SolidFire Collector v2.0.0 is ready
- Intro
- Other objectives
- What's new in SFC
- Other usability improvements
- Dependencies and the messy code
- Grafana and Python
- Packaging
- Security
- What's next for SFC
- Conclusion
- Demo
Intro
As I've been working on SFC v2 and it looks kind of ready.
Since I took ove HCI Collector, I released v0.7 in 2021 and in that announcement post I mentioned some things I wanted to improve and some that I thought were unfixable, so it was interesting for me to read that post yesterday and reflect on it.
Quick list from both of these categories and how it's going:
- Too many API calls making collector unable to complete in 60s (default collection interval) - solved
- Data retention "tuning", including expiration - kind of solved by not even trying (see below)
- New DB back-end - solved (but not in the way I expected)
Other objectives
In making SFC v2 I wanted to achieve several other objectives and solve problems.
Modernize the code, so that I can update, test (which includes better logging) more easily.
Remove vSphere collector, because including code that forced me to find vSphere to test with didn't add value, especially since NetApp HCI was killed and finding such test environments became more difficult.
Keep up with new Grafana releases. HCI Collector v0.7 used v8, but in it I also had some "cool plugins", so I couldn't just assume nothing would break. And break they did.
Keep external dependencies at a minimum. Not that I dislike them, but as you can see from the vSphere and Grafana plugin examples, just those two were annoying enough, and then there are security updates for everything, from these 3rd party add-ons to Python modules.
Make it easy to do more. In order to do that, I had to make the code both save space (related to DB back-end) and time (related to scheduling, async, and other bits and pieces).
Drop Grafana dashboards, because I'm not good at dashboard design and people can create average dashboards on their own. I still have a "reference dashboard" with "one of each" to get people started, but I'm not going to include it or attempt to create dashboards that use external plugins. This also removes the need to update and test Docker Compose and Kubernetes templates every time there's a new Grafana or plugin security bug.
What's new in SFC
First, I want to emphasize SFC is just a simple script, not some sophisticated program with award-winning algorithms.
But still, if you're using HCI Collector or just generally curious what can possibly be improved in a small script, here's what happened.
Rewrite
This isn't a "feature" or improvement, but I want to say it - I've rewritten HCI Collector five times.
The first two attempts in 2022 and 2023 were with multithreading and the right structure, but every time I got busy and couldn't find the bits and pieces of code that I kept around in various VMs and containers.
The third attempt was based on asynchronous requests, but I lost it due to two unrelated mistakes in OS management (first one problem happened and the first copy was gone, then another in a different place wiped the second copy, and all work in progress was lost).
The fourth attempt was with async and Telegraf, but I realized it was too complicated.
The final attempt was this one, async with almost everything else done manually.
If this sounds like an advertisement for off-site backups, it is. 3-2-1 is a thing!
Aside from that, I haven't been idle when it comes to SFC - since v0.7 came out I've tested and updated Grafana 8, collector for VMware (including testing with VMware vSphere 7), built and tested Kubernetes templates, etc.
Back-end database change
In that post related to v0.7 I said I wanted to change back-end from Graphite to something else, but not InfluxDB because of the stupid query language they have.
What I didn't know was that I was looking at FluxQL, which was supposed to be one of the highlights of InfluxDB v2.
Later I discovered InfluxDB v1 supported InfluxQL which didn't look bad. I've since evaluated other databases, and (explained here) came to the conclusion that InfluxDB v1 is in fact a good choice.
How does this change help?
InfluxDB v1 uses less space, which was the main reason and helped me achieve several of those objectives listed earlier.
I now use InfluxDB v1 in EPA and SFC, which also helps. Plus InfluxDB v3 is coming soon.
Asynchronous execution
That's a "qualify of life" improvement, as they say.
I blogged about it here.
Drop SolidFire Python SDK
I'm not sure if I had to do it, but I think it can't be easily integrated with async execution.
The second reason is I also wanted to eliminate that dependency if I could. (I could.)
The third reason is there are some minor quirks or even bugs which resulted in wasted time:
- ListVolumeQoSHistograms should probably ignore invalid requests
- .to_json() should change null to None rather than skip the KV pair
- asyncDelay missing from list_volume_stats_by_volume output
Scheduling and performance improvements
HCI Collector ran everything in one big loop. Depending on cluster size and configuration it could cause the script to miss the next interval. It also collected way too much data because everything was collected every time.
SFC v2.0.0 solves that:
- Three schedules - high, low and medium frequency, with the stuff that doesn't need to be collected often collected less often. For example, volume efficiency is collected once every hour.
- Now there's much, much less data collected, and the little that's collected is nicely compressed by InfluxDB v1
Anecdotal evidence (from my SolidFire Demo VM with 32 volumes) shows HCI Collector v0.7.1 takes around 4 seconds per iteration whereas SFC takes the same time only once every hour (when all functions, high-, medium- and low-frequency, run at the same time).
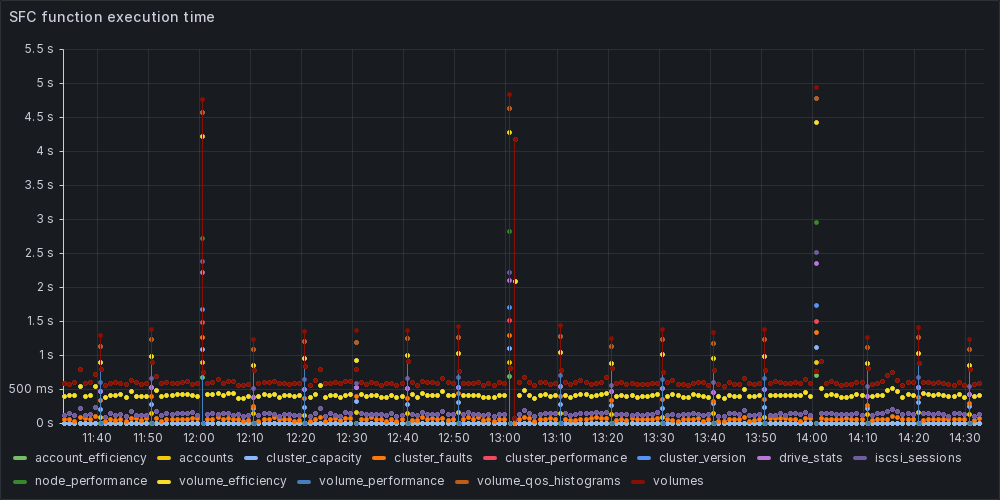
Normally - by that I mean high-frequency schedules that run every minute (by default) - it's less, around 1 second.
Even that is easy to overcome by moving a function to a lower-frequency schedule or adding a random delay to medium and low frequency schedules but as-is, it's already possible that even with default settings a 16+ node cluster can complete high-frequency jobs within a 60-second interval.
When only high-frequency collection is compared to HCI Collector - which maybe isn't "fair" because SFC's high-frequency collection does less work, but that 60s collection is what caused problems - SFC is multiple times faster.
Logging improvements
Logs seem usable now, with high, medium and low frequency schedules as well as all important function logged in a way that makes it easy to see what's going on and effortlessly identify time-consuming functions (which may be necessary for very large clusters, in order to schedule them less often).
This example shows:
- SFC schedules four hi-frequency tasks and also four med-frequency tasks
- As each task is done, we can see how much time consumed, and that's also available by schedule frequency
- For example medium frequency tasks started at 09:13:34Z and completed at 09:13:34Z (it took 0.17s)
2024-05-30T09:13:34Z - INFO - hi_freq_tasks - High-frequency tasks: 4
2024-05-30T09:13:34Z - INFO - run_coroutine_job - Running job "med_freq_tasks (trigger: interval[0:10:00], next run at: 2024-05-30 09:23:34 CST)" (scheduled at 2024-05-30 09:13:34.057436+08:00)
2024-05-30T09:13:34Z - INFO - med_freq_tasks - Medium-frequency tasks: 4
2024-05-30T09:13:34Z - INFO - cluster_capacity - Cluster capacity names collected. Sending to InfluxDB next.
2024-05-30T09:13:34Z - INFO - volume_performance - Calling _split_list with all_volumes length 32 using chunk size 24
2024-05-30T09:13:34Z - INFO - _split_list - Split 32 long list using chunk size: 24
2024-05-30T09:13:34Z - INFO - volume_performance - Processing volume batch of 24 volumes
2024-05-30T09:13:34Z - INFO - cluster_capacity - Cluster capacity collected in 0.11999988555908203 seconds.
2024-05-30T09:13:34Z - INFO - cluster_faults - Cluster faults gathered in 0.125 seconds.
2024-05-30T09:13:34Z - INFO - iscsi_sessions - iSCSI sessions collected. Sending to InfluxDB information about 3 sessions from one or more clients. Time taken: 0.13699984550476074 seconds.
2024-05-30T09:13:34Z - INFO - cluster_performance - Cluster performance collected in 0.1400001049041748 seconds.
2024-05-30T09:13:34Z - INFO - volumes - Volumes collected in 0.14599990844726562 seconds.
2024-05-30T09:13:34Z - INFO - accounts - Tenant accounts gathered in 0.1640000343322754 seconds.
2024-05-30T09:13:34Z - INFO - med_freq_tasks - Completed medium-frequency collection and closed aiohttp session. Time taken:0.17300009727478027 seconds.
2024-05-30T09:13:34Z - INFO - run_coroutine_job - Job "med_freq_tasks (trigger: interval[0:10:00], next run at: 2024-05-30 09:23:34 CST)" executed successfully
2024-05-30T09:13:34Z - INFO - volume_performance - Volume performance batch with 1 items done
2024-05-30T09:13:34Z - INFO - volume_performance - Processing volume batch of 8 volumes
2024-05-30T09:13:34Z - INFO - volume_performance - Volume performance batch with 2 items done
2024-05-30T09:13:34Z - INFO - volume_performance - Volume performance gathered in 0.23599982261657715 seconds
2024-05-30T09:13:34Z - INFO - node_performance - Node stats collected in 0.34200000762939453 seconds.
2024-05-30T09:13:34Z - INFO - hi_freq_tasks - Completed combined high-frequency collection. Sending to InfluxDB next. Time taken:0.3489999771118164 seconds.
It looks like one would expect - not better, not worse. But in HCI Collector logging was worse.
QoS Histograms
HCI Collector v0.7 has QoS histograms, but I rewrote that part so that it's more usable in Grafana.
- Histograms' bucket names are renamed on the fly for proper sorting and ease of use
- Volume names are added and available in histogram measurements (before only volume IDs were available because the API call doesn't return volume names, only IDs)
- Examples of InfluxQL queries and panels for histograms that I think I understand are given in SFC documentation
- I'm still trying to understand how the rest of them work, and will update reference dashboard and SFC docs if I make progress (dependent on whether or not NetApp updates the docs, for which I opened a Github issue)
Other usability improvements
This is mostly related to the "unfixable" problem mentioned at the top.
If I were you I probably wouldn't have clicked on the referenced post about HCI Collector v0.7 announcement so I'll explain very briefly: SolidFire's volume names are tags and can therefore be duplicate. IDs are what's used to identify objects.
That means in most API responses you don't get any names and that "affects" volumes, tenants/accounts, iSCSI initiators, Volume Access Groups, etc. Before I resisted relying on names, but because it's impossible to enforce volume name uniqueness in SFC (except by refusing to work with such clusters), I stuck with IDs except in cases where panels already had volume names (as I took over HCI Collector from a colleague who since left NetApp).
Now I gave up on that and added more names to metrics. I still don't like it, but at least volume and account names.
This seems like a small thing, but it also took a lot of iterations - try to poll volumes regularly and store in a global variable, then hit some problems and do it differently. Then you get it to work, but it doesn't work well in Grafana, then change. Then it works in Grafana, but it sucks, so do it again (see below what I mean):
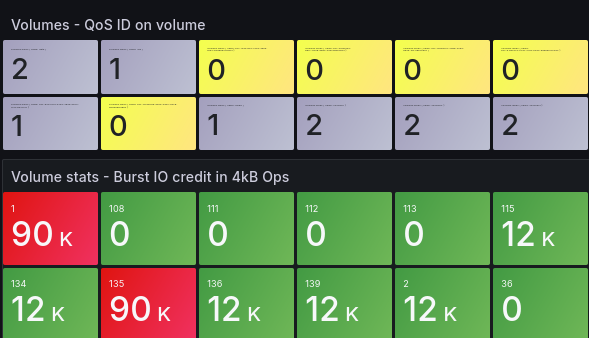
Notice how you aren't noticing anything in the first panel? And then notice how the second panel uses volume IDs so it's easy to see volume ID 1 has 90,000 unused burst IOPS. What's friendly now?
The issue in the first panel is that's a so-called "user-friendly" panel with volume names. (Now this makes me think that may have been one of the several reasons why I never implemented this in more measurements back in 2021.)
Normally it will look good, but abnormally it won't.
Even we maximize the panel, it's still useless. WTF???
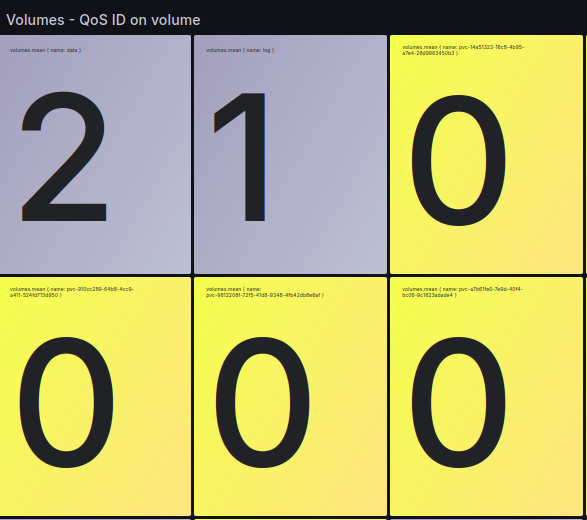
The reason is (focus on the yellow rectangles) that some names are simply too damn long. Yep, Cooper Netties!!! pvc-something-something….
So - defaulting to names may not be always better because sometimes you won't see nothing unless you want to have a panel that doesn't look like you'd want it and you're staring at tables instead of what you really want to see.
The cost?
- One new cost is extra API lookups to cross-reference names with API responses of the stuff I'm after, which means that performance and scheduling improvements are even more than what can be seen by comparing run times.
- Another cost is that SFC no longer supports clusters with duplicate object names. If you have as few as two volumes with the same name, errors will happen and won't be handled (because there's no good way to handle them). The solution is to properly manage storage.
For Stat visualization account names should work well for folks who have up to several compute or Kubernetes clusters.
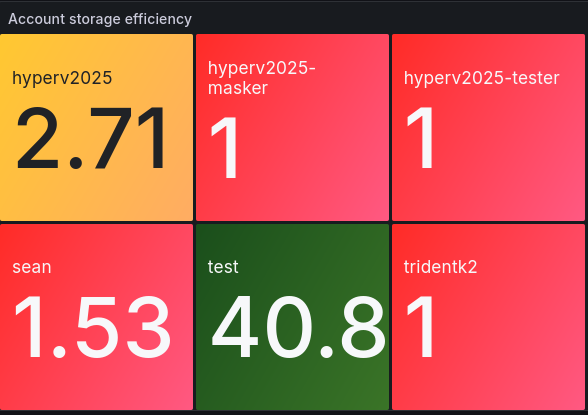
People who have just one vSphere cluster won't find that useful at all (in that case they likely have just one tenant account), while at scale Stat hits "the volume problem" and you simply have to use something else (table, etc.).
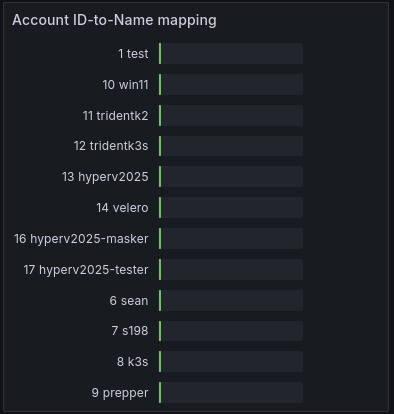
A workaround (if that counts) is to use account (or volume) IDs and have a separate panel with an ID to name mapping so if something stands out, you can look it up quickly. I'm not sure how practical this is, but personally I like it.
Dependencies and the messy code
The code is a bit messy and I know it could be improved.
One perhaps less obvious reason for that is I didn't use SolidFire Python SDK or InfluxDB libraries, so all API communication was coded "semi-manually".
That involved a fair bit of learning curve and trial-and-error which doubled or tripled the time I spent on SFC v2, so I'm not sure it was worth it. But at least I won't need to update those components or deal with their issues or bugs.
If I approached this last rewrite more methodically, I would have had a cleaner code. If I used at SolidFire SDK and InfluxDB modules. In hindsight.
What stops me from fixing it now? What I learned from rewrite attempts 1-4 was if one can't count on extended periods of regular spare time, trying to make something perfect dramatically increases the risk of delays. I'm not perfectly happy with the code and I would also like to write tests and enforce typing, but at my speed and with my spare time that could mean SFC v2 would take 3-4 more months to complete.
HCI Collector libraries that were removed:
- SolidFire Python SDK - to simplify SFC
- graphyte - small Python library for Graphite, as DB has changed to InfluxDB
SFC v2.0.0 added:
- APScheduler - to improve scheduling and performance
- aiohttp - to make it easier to use async IO (aiohttp has half a dozen own dependencies, but it's actively maintained)
The other day I considered "offloading" InfluxDB-related work to Telegraf, but as I explained in that post I thought my "manual" ad-hoc approach works well enough and Telegraf container alone is 250 MiB, while my SFC v2 (packaged with Alpine base image) less than 70 MB. If the simple send-to-Influx function in SFC turns out to be garbage, I would still try using a Python module before using Telegram.
Grafana and Python
Most recently Grafana kicked out unsigned plugins and also some based on Angular or whatever, so I'm glad I made the decision to not provide dashboards or use external plugins - that's just too much to handle for a tiny single contributor project.
SFC v2 reference dashboard was created using Grafana 11 - which I also tested in preview with the old HCI Collector, so I knew it wasn't too different and because I use no plugins, it's easy to switch to a new version mere weeks after v11 came out. SFC likely works with older versions because there aren't any dependencies and InfluxDB v1 is mature and older versions also support it.
I used Python 3.10 because that's what Ubuntu 22.04 has and I don't use any fancy features found in latest & greatest Python releases.
Packaging
Like before, it's a single script that can run from the CLI.
I version this release as v2 because although last versions of HCI Collector were v0.7.x, SolidFire collector script contained in them was v1+ and given the improvements and the big change of back-end DB, version 2 seems justified.
SFC container v2.0.0 has been published to Docker Hub for both ARM64 and x86_64. But most users won't be able to use it (see next section).
Docker Compose and Kubernetes templates are still on my to-do list.
Security
Partially because it's the right thing to do, partially because it's boring work, SFC v2 no longer helps the user circumvent HTTPS security by accepting snake oil certificates.
If SolidFire TLS certificate cannot be validated, SFC won't start.
Most users use either internal or "fake" TLS certificates, which means most likely such certificates will have to be built into their container (seems like the easiest way to me). That's why I think almost no one will be able to use the container I posted on Docker Hub. But the SFC repository provides instructions on how to build SFC with custom certificates, so it's just a small extra effort.
Importing TLS certificates into OS certificate store is easy, so for VM users this change isn't going to be a problem.
I know some folks will be upset that they have to do the "extra" work, but I've often mentioned this:
- SFC can use a read-only account to access the SolidFire API
- That account - among other things - collects data about storage accounts, volumes, and more. Storage account details contain CHAP passwords
- The next step is fake TLS certificates. If SFC accepts invalid certificate, an attacker can position himself between SFC and SolidFire and get CHAP passwords for all storage accounts
- Since they're able to insert themselves between SFC and SolidFire (which is probably on Management LAN or at least internal network, they probably can also control some client on iSCSI network, which means they may be abel to access all data on tenants whose volumes are protected only by CHAP)
- That means SFC that accepts fake certificates can put you out of business. An attacker can't delete anything using a read-only admin account, but they may be able to read storage data.
If you run SFC on a properly secured VM or container stack and don't accept fake TLS certificates, then you're pretty safe and that's why there's no need to spend extra time to make it less secure.
In fact it should also default to TLS when it connects to InfluxDB - it uses HTTP now - but:
- In most cases InfluxDB will run in the same namespace or VM/Docker host
- Nothing confidential is stored in InfluxDB. Volumes, storage account names (not passwords), performance statistics, that kind of things
What's next for SFC
I still have to clean up the code and re-create the docs I recently created for the version that was supposed to work with Telegraf, but I'm already thinking about some enhancements that shouldn't take years.
Kubernetes-related improvements. Trident has very basic metrics which aren't that useful. Also, when you look at the various problems with Kubernetes PVCs, you probably wish there was a way to easily separate pvc- volume names from the rest, so that you can view volume names without Grafana tricks (regex can be used to hide pvc-* names, but when you do want to see them, they still look tiny, so more tricks are needed). I'm thinking about adding a separate measurement - even at the cost of duplicate data, it should be okay if it's collected at medium frequency - and populate those with Kubernetes-related info (volume attributes, for example, which I don't parse now as they may be complex).
Backup-related integration. This has two parts: one is for SolidFire's backup-to-S3 (already "solved", see here) and another is for popular backup tools like Velero, about which I blogged often.
- In the case of SolidFire backup-to-S3, if these backup metrics are collected, InfluxDB can be a nice reporting tool for backup-to-S3 without the need to set up another container or database service. Secondly, those measurements can be cross-referenced against the rest of SFC database.
- In the case of Velero and other OSS backup tools, I don't plan to reinvent the wheel if there's already an InfluxDB-compatible collector for Velero (I'd have to check), but I do plan to investigate cross-referencing with SFC metrics, so that it becomes possible to visualize Kubernetes volumes without a recent backup, for example
Low-priority items:
- Power consumption - I added that to EPA (for E-Series), but I'm not too eager to add it to SFC because it seems relatively useless, I don't have convenient access to physical SolidFire nodes, and SFC would have to connect to node management IPs (rather than just to the cluster MVIP) which makes integration harder as node MIPs have to be reachable as well and at a different port (442). The API method is GetIpmiInfo, if you want to add it yourself
- Account attributes - I wrote about them here. I've never heard of anyone who uses that, and I hadn't known about them until last month… But I'm also wondering if they may be useful as explained in that post. I'll add them the same way I plan to make Kubernetes-related volume attributes available, I just need to find a use case for that. I mentioned in one of the backup posts, one potential use case is account attributes could store a backup plan for SolidFire's Backup to S3 feature, and then parallel backup from S3 could be initiated by simply querying InfluxDB, and store backup metrics to InfluxDB for visualization. I'm still not sure this is valuable, though
- Disaster Recovery (DR) and replication-related metrics - SFC v2 gathers some extra KVs that could be useful for that, but I don't have a recipe for using that in SolidFire cluster failover and fail-back. But I may gather the rest of KVs that are necessary if I hear from a SFC user who need that. I'd have to setup two SolidFire clusters to test this and spend a week or two (of free time) on that, so I won't do it without knowing if anyone needs it
- Other hypervisors and container platforms - the cross-referencing idea also applies to vSphere, Hyper-V, KVM, etc. - but I don't know who needs what and don't want to go back to the days of vSphere integration and all the burden associated with maintaining related documentation and integration examples. But I may do it if I come across a customer who uses SFC and lets me know what they need.
There are still some annoyances that I haven't yet investigated. For example, Graphite made it easy to select "Top N" items by value. I think InfluxDB can do that too, but the question is how to do it in Grafana without composing InfluxQL queries by hand.
Conclusion
After several failed attempts, one of them involving catastrophic loss of data, I'm happy that I've managed to get the new SFC to a usable and release-able state. For years I've been wondering if I'll ever get here - it's like one of those Github comments from years past which say "I'll fix this in coming days" and the issue is still open.
The code, documentation and a reference dashboard will be posted to the repo within days.
Demo
- Detailed introduction to SFC v2 - 14m11s
- If you're just curious about what's collected, see the reference dashboard and query examples in the repository