Get Trident's SolidFire metrics from outside Kubernetes
If I had a SolidFire array in a VM and container environment (which I do), I'd prefer to run Prometheus and Grafana in VMs, rather than cram the monitoring into Kubernetes.
If you have that kind of a setup, you might prefer the same. Now, since newer releases of Trident export some Prometheus metrics, users who run monitoring infrastructure outside of Kubernetes may wonder how to get those metrics out.
First, see whatcha got:
$ kubectl get pods -n trident
NAME                           READY   STATUS    RESTARTS   AGE
trident-csi-5c98ff74fb-rwj4f   5/5     Running   0          23d
trident-csi-fhrjj              2/2     Running   0          23d
trident-csi-gq9w6              2/2     Running   0          23d
trident-csi-x9cnm              2/2     Running   0          23d

$ kubectl describe pod trident-csi-5c98ff74fb-rwj4f -n trident
Name:         trident-csi-5c98ff74fb-rwj4f
Namespace:    trident
Priority:     0
Node:         k2/192.168.1.19
Start Time:   Sat, 01 May 2021 13:02:42 +0000
Labels:       app=controller.csi.trident.netapp.io
              pod-template-hash=5c98ff74fb
Annotations:  <none>
Status:       Running
IP:           10.244.1.26
Okay, so the one with the long name is the controller, running on internal IP 10.244.1.26 on worker k2 (192.168.1.19). (This is my arm64 K8s cluster, by the way, I don't want to run a ton of services on it when I have rock-solid x86 VMs and my hypervisor is on 24x7).
From the node where the controller is running, you can get its Prometheus metrics.
$ curl 10.244.1.26:8001/metrics
# HELP go_gc_duration_seconds A summary of the pause duration of garbage collection cycles.
# TYPE go_gc_duration_seconds summary
go_gc_duration_seconds{quantile="0"} 9.1588e-05
go_gc_duration_seconds{quantile="0.25"} 0.000124298
[...]
In order to get to them from outside of the cluster you need to set up some sort of forwarding. This approach sucks but it will do for a blog post.
kubectl port-forward --address 192.168.1.18 pod/trident-csi-5c98ff74fb-rwj4f 9090:8001 --namespace="trident"
Note that with this command I'm forwarding port 9090 on the worker k1 (192.168.1.18) to the Trident pod on k2 (192.168.1.19).
Now we can use the browser to visit http://192.168.1.18:9090 and see our Trident metrics.
# HELP go_gc_duration_seconds A summary of the pause duration of garbage collection cycles.
# TYPE go_gc_duration_seconds summary
[..]
# TYPE trident_backend_count gauge
trident_backend_count{backend_state="online",backend_type="ontap-nas"} 1
trident_backend_count{backend_state="online",backend_type="ontap-nas-economy"} 1
trident_backend_count{backend_state="online",backend_type="solidfire-san"} 1
Now tell your Prometheus server to get the metrics off that forwarded IP and port (192.168.1.18:9090).
The last step for Grafana users is to add the Prometheus server to Data Sources and create some dashboards.
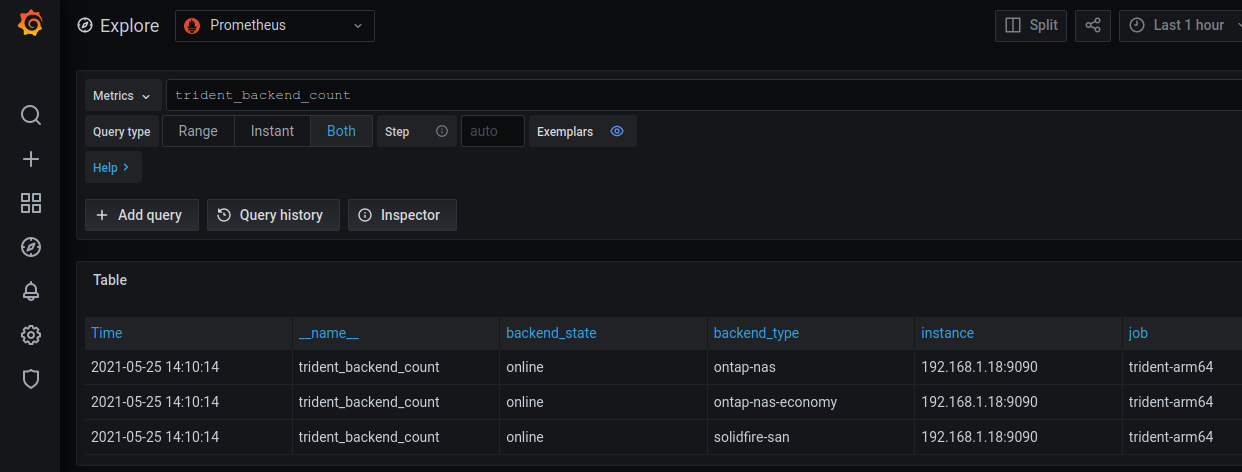
There isn't much to see (yet) in terms of SolidFire-specific metrics, but it can be helpful when you want to see how Trident is doing - how many volumes, how many backends, and stuff like that.
To get detailed SolidFire metrics and ready-made dashboards please consider SolidFire-Exporter (especially for Prometheus) or HCICollector, which uses Grafana with Graphite back-end.