SolidFire SNMP v3, Telegraf, Prometheus, Grafana
NOTICE: any and all credentials and tokens on this page are samples, not leaked.
- Introduction
- Enable SNMP V3 on SolidFire
- Install and configure Telegraf
- Prometheus
- Grafana
- Related stuff
- Conclusion
Introduction
As you may know, for collection and visualization of SolidFire metrics I recommend SolidFire-Exporter followed by HCICollector. How they (in my opinion) differ, I described here.
Now this post isn't (just) about yet another way to use Grafana, it's really meant to highlight one use case for SNMP.
Recently I recently wrote this mega-post on SolidFire SNMP because no one else would or could so far. Then last night I needed to create a monitoring setup for home IT so I revisited Telegraf and Prometheus. Then it occurred to me that on the heels of that SNMP post, I could write a post about that.
Before we move on:
- HCICollector uses Python to collect SolidFire data via the SolidFire API and sends it to Graphite
- SolidFire-Exporter uses the same approach, but without any SolidFire SDK and the database is Prometheus
So, why SolidFire SNMP v3, Telegraf and Prometheus?
The main advantage or use case is when you won't or can't obtain a SolidFire API account (i.e. cluster account) for monitoring purpose, or when access policies don't allow such access (remember that it unfortunately isn't possible to limit a cluster account to Get or List type methods only).
Another use case is to complement SolidFire-Exporter and HCICollector metrics. Neither of those collect the OS-level stuff that you can get from SNMP, so if you for some reason want that information, you can have SNMP gather these details from OS-level MIBs.
If you can enable SNMP V3 on SolidFire, you can securely fetch SNMP metrics with Telegraph, scrape them with Prometheus, and visualize them in Grafana.
Let's do it!
Enable SNMP V3 on SolidFire
See TFM or read that SNMP mega-post.
Long story short, my user scaleoutsean uses these passwords to snmpwalk SolidFire MVIP 192.168.1.34.
snmpwalk -v3 -l AuthNoPriv -u scaleoutsean -a MD5 -A "NetApp123$" \
  -x DES -X "NetApp123$" \
  192.168.1.34 \
  1.3.6.1.4.1.3809
1.3.6.1.4.1.3809 is SolidFire OID.
Install and configure Telegraf
Find a VM and install Telegraf, or run it from container. Make sure SolidFire MIBs have been compiled for your SNMP client or else it won't be able to translate them!
My telegraf.conf fetches data from SolidFire MVIP at 192.168.1.34:161.
Which specific counters to collect is up to you - you can find them from SNMP walk above. In agent section below, I changed default interval values from 10 to 60 seconds - there's no need to poll SNMP server too frequently.
[global_tags]
[agent]
  interval = "60s"
  round_interval = true
  metric_batch_size = 1000
  metric_buffer_limit = 10000
  collection_jitter = "0s"
  flush_interval = "60s"
  flush_jitter = "0s"
  hostname = "solidfire-dr"
  omit_hostname = false

[[inputs.snmp]]
  agents = ["udp://192.168.1.34:161"]
  version = 3
  agent_host_tag = "scaleoutsean"
  sec_name = "scaleoutsean"
  auth_protocol = "MD5"
  auth_password = "NetApp123$"
  sec_level = "authNoPriv"
  priv_protocol = "DES"
  priv_password = "NetApp123$"
  # Generic stuff
  [[inputs.snmp.field]]
    oid = "RFC1213-MIB::sysUpTime.0"
    name = "uptime"
  [[inputs.snmp.table.field]]
      oid = "IF-MIB::ifDescr"
      name = "ifDescr"
      is_tag = true
  [[inputs.snmp.field]]
    oid = "RFC1213-MIB::sysName.0"
    name = "source"
    is_tag = true
  # SolidFire-specific stuff
  [[inputs.snmp.field]]
    oid = "SOLIDFIRE-STORAGECLUSTER-MIB::networkUtilizationCluster.1"
    name = "ClstrMgmtNet Util"
  [[inputs.snmp.field]]
    oid = "SOLIDFIRE-STORAGECLUSTER-MIB::networkUtilizationStorage.1"
    name = "ClstrStrgNet Util"
  [[inputs.snmp.field]]
    oid = "SOLIDFIRE-STORAGECLUSTER-MIB::clusterStatsReadOps.1"
    name = "ClustrReadOps"
  [[inputs.snmp.field]]
    oid = "SOLIDFIRE-STORAGECLUSTER-MIB::clusterStatsWriteOps.1"
    name = "ClustrWriteOps"
  [[inputs.snmp.field]]
    oid = "SOLIDFIRE-STORAGECLUSTER-MIB::clusterStatsPercentUtilization.1"
    name = "ClustrUtilPctg"
  [[inputs.snmp.table]]
    oid = "IF-MIB::ifTable"
    name = "interface"
    inherit_tags = ["source"]

[[outputs.prometheus_client]]
  # metrics_path defaults to '/metrics'
  # scheme defaults to 'http'.
  # for better security, fiddle with the following
  # basic_username = "Foo"
  # basic_password = "Bar"
  # tls_cert = "/etc/ssl/telegraf.crt"
  # tls_key = "/etc/ssl/telegraf.key"
  ## Set one or more allowed client CA certificate file names to
  ## enable mutually authenticated TLS connections
  # tls_allowed_cacerts = ["/etc/telegraf/clientca.pem"]
  listen = "192.168.1.12:9273"
I let Prometheus client scrape SNMP metrics at 192.168.1.12:9273.
To add security (basic HTTP authentication and HTTPS), refer to the configuration segment above or read the plugin documentation.
Prometheus
We need to scrape that stuff. Above I mentioned security. The below uses HTTP. If you run Prometheus on the same server as Telegraf, it doesn't matter. But you can use HTTPS with basic authentication or implement other security measures.
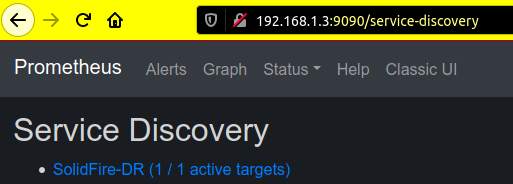
Either way, add this job section to your Prometheus client/server, and once you see it's gathering SNMP data from Telegraf, move on.
scrape_configs:
  - job_name: 'SolidFire-DR'
    static_configs:
    - targets: ['192.168.1.12:9273']
Reload or restart Prometheus and check if data is being scraped.
Grafana
In Grafana sources, add your Prometheus instance. In my environment that's 192.168.1.3:9090.
Using some of the above, I was able to create exciting cluster network and cluster performance gauges, as well as a meaningless pie chart of read-write operations performed so far.
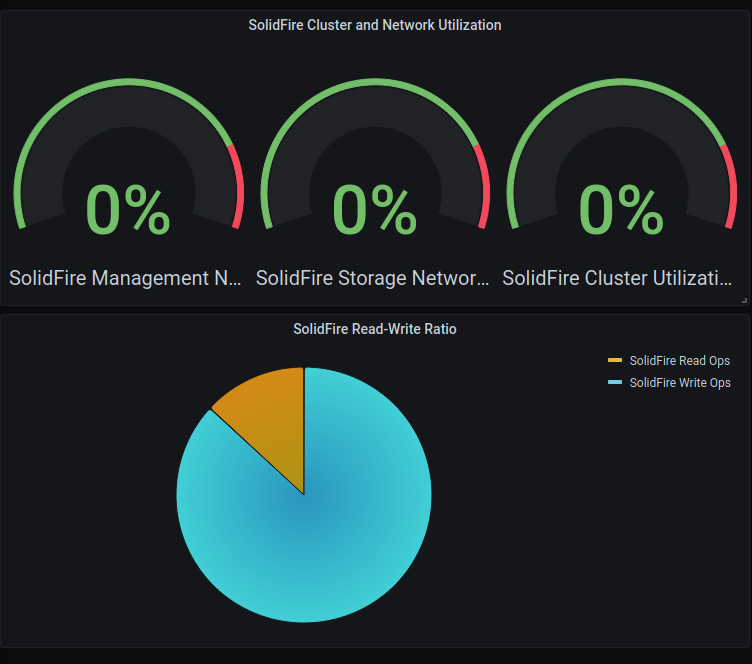
There's nothing to it - just add SNMP counters you like. No computation or tricks. Here's how the three gauges look like in JSON output of this dashboard:
"targets": [
        {
          "exemplar": true,
          "expr": "snmp_ClstrMgmtNet_Util",
          "interval": "",
          "legendFormat": "SolidFire Management Network Utilization",
          "refId": "A"
        },
        {
          "exemplar": true,
          "expr": "snmp_ClstrStrgNet_Util",
          "hide": false,
          "interval": "",
          "legendFormat": "SolidFire Storage Network Utilization",
          "refId": "B"
        },
        {
          "exemplar": true,
          "expr": "snmp_ClustrUtilPctg",
          "hide": false,
          "interval": "",
          "legendFormat": "SolidFire Cluster Utilization",
          "refId": "C"
        }
      ]
Related stuff
My static Web site doesn't spy on visitors and doesn't generate useful suggestions for related posts, so I'll make some manual recommendations:
- Configuring Grafana & Prometheus in more detail - this is for metrics collected with SolidFire-Exporter, but there's more detail and screenshots on getting the Grafana and Prometheus parts to work
- If you're using Kubernetes: I just rediscovered this post about SolidFire Trident metrics in Prometheus, in the case you use Kubernetes or Docker
Conclusion
All modern monitoring solutions support SNMP version 3, so don't count it out!
Although SolidFire MIB files aren't very complete, they do provide key indicators. You can get more metrics - from underlying Linux OS - by snmpwalk-ing the nodes' Management IP's and the nodes' IPMI IP (the latter supports up to SNMP v2).
This approach is secure and does not require the use of a cluster account for API access.
In fact, if you don't change your storage configuration often (that is, you don't want to adjust your Grafana dashboards often to fix them up for new or old volumes), you can also enable SNMP Traps (push notifications) and largely avoid having to use the SolidFire Web UI and Hybrid Cloud Control for monitoring (you'd still use them for management - to create volumes or take snapshots, for example). You'd have to configure Telegraf or Prometheus to receive SNMP v2 Traps (different Telegraf plugin), but with that you'd have Grafana with alerts for fault notifications without using a cluster administrator account.