Monitor SolidFire with SNMP
NOTICE: any and all credentials and tokens on this page are samples, not leaked.
- Get SolidFire MIBs
- What's in SolidFire MIBs
- Enable SNMP service on SolidFire cluster
- What to monitor (documentation and reference material)
- Walk-Through: AdRem NetCrunch with NetApp SolidFire
- Conclusion
- Demo
- Appendix A
Get SolidFire MIBs
Login to the SolidFire Web UI and download the two MIBs from Cluster tab.
Compile them using a MIB compiler for your monitoring solution.
What's in SolidFire MIBs
| Group | Description | Example |
|---|---|---|
| 0 | notifications | clusterFaultNotification |
| 1 | volumes | volByAccountStatsZeroBlocks |
| 2 | nodes | nodeStatsCpuUtilization |
| 3 | cluster | clusterStatsPercentUtilization |
| 4 | drives | eventDriveID (in reports) |
| 5 | reports | eventSeverity |
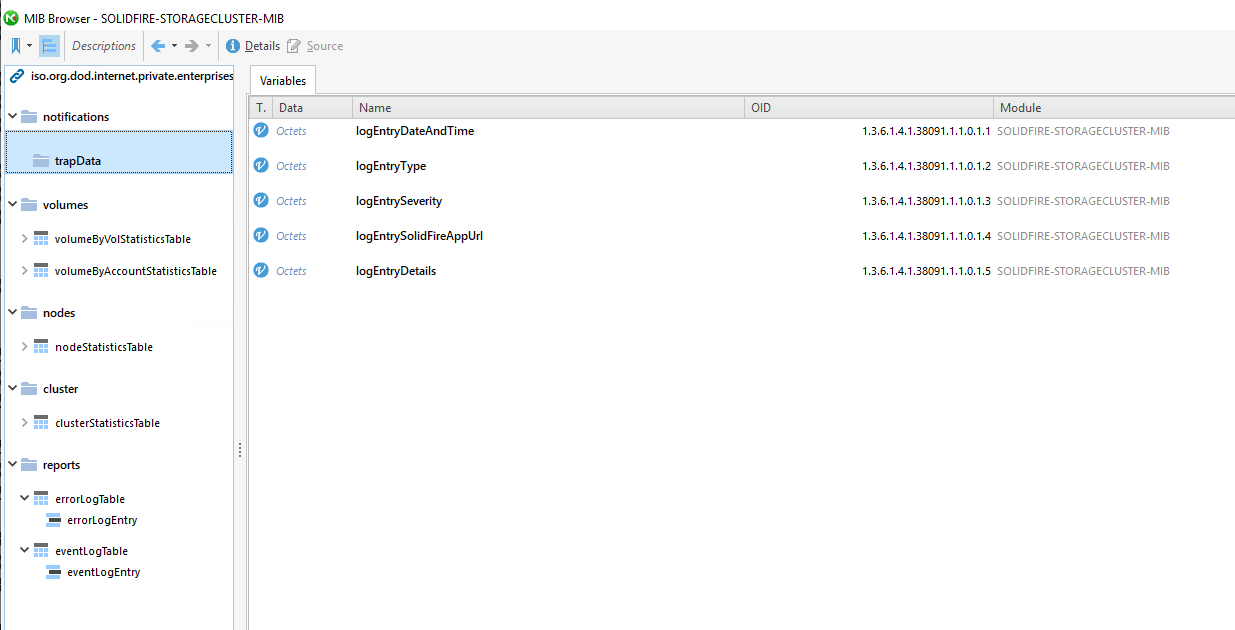
Group 0 is SNMP Traps (notifications) for Faults, while Group 5 is SF Errors and Events (the content of each group are visible in these screenshots).
To translate OIDs to English, we can use at least 2 methods:
- review entries in your SNMP browser (easy; see screenshots at the bottom), or
- run
snmptranslate(assuming you've compiled the two SolidFire MIBs on this system) on OID 1.3.6.1.4.1.38091 (the SolidFire OID).
A lot of SolidFire SNMP data comes from reports (event logs). The second significant category is usually volume objects (volume IDs, volume performance metrics….) - depending on how many volumes there are.
Example from a five-node SolidFire cluster:
| Group | Events/Items |
|---|---|
| 1.3.6.1.4.1.38091.1.1.1 | 2904 |
| 1.3.6.1.4.1.38091.1.1.2 | 60 |
| 1.3.6.1.4.1.38091.1.1.3 | 6 |
| 1.3.6.1.4.1.38091.1.1.4 | 0 |
| 1.3.6.1.4.1.38091.1.1.5 | 7500 |
Note that you can also enable SNMP on hardware level - see this post. This is more useful for NetApp HCI compute nodes and not very useful for NetApp HCI (or SolidFire) storage nodes, because SolidFire SNMP alerts cluster administrator to all appliance hardware problems you need to know about - the "extra" stuff from hardware is usually noise.
But if you want to monitor hardware temperature or watch RPMs of your PSU, that's available. For NetApp HCI compute appliances, contact NetApp Support for the hardware MIB file.
Enable SNMP service on SolidFire cluster
In Cluster > SNMP:
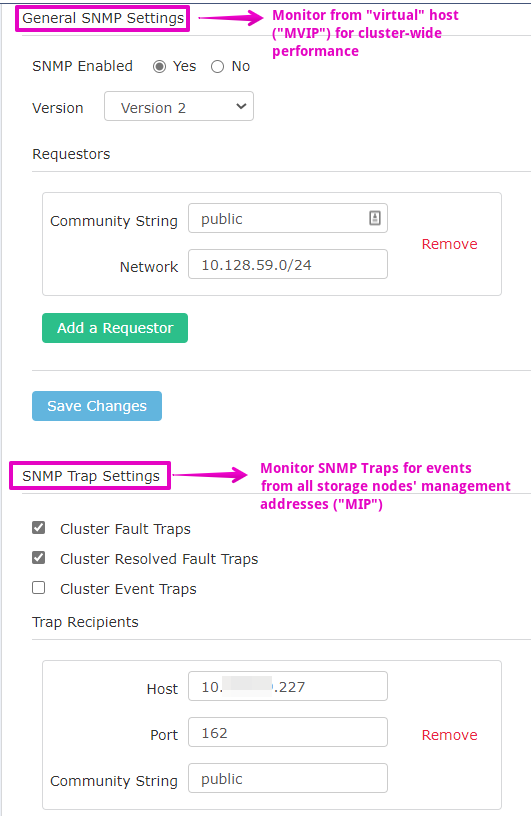
- "General SNMP Settings" - enable SNMP and make it accessible to your monitoring solution.
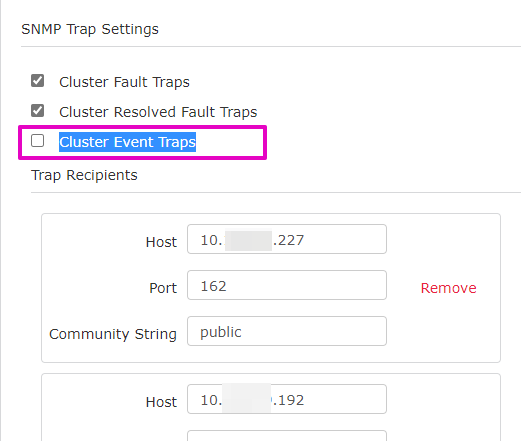
- "SNMP Trap Settings" - this can create a lot of entries, so use sparingly (only for Cluster Fault Traps and Cluster Resolved Fault Traps, for example)
Further below you can see screenshots of three SNMP tables (Traps, Errors, Events).
To let SNMP Trap Recipient receive SNMP traps we usually need to open port UDP/162). For example, in my environment I have a SolidFire mNode, Demo VM Physical IP and Demo VM Virtual IP at 192.168.1.28 - 192.168.1.31, so this was enough for me (I set a "range" but you could set rules for individual IP addresses, of course):
iptables -A INPUT -s 192.168.1.29/30 -p udp --dport 162 -j ACCEPT
As you can see in that walk-through below, SNMP Traps are sent from physical nodes' management IPs (i.e. MIP's, not from the Cluster Management Virtual IP (MVIP)).
Remember to use the recommended firewall CLI command for your OS (not necessarily iptables). On a system where iptables may be used, the above would take care of all three SNMP client IPs. For physical SolidFire nodes (appliances) and 3rd party storage systems with eSDS you may also want to allow incoming SNMP Trap traffic from IPMI (BMC) NICs, if you've enabled SNMP Traps on BMC. Then we'd save iptables or otherwise persist your SNMP server's firewall rules (depending on your OS).
For cluster monitoring snmpwalk MVIP, for SNMP Trap notifications allow access to SNMP Trap ports to all SolidFire MIPs and possibly BMCs and mNode/HCC:
SNMP v2
If we've enabled SNMP v2 on MVIP (community: public), we should be able to SNMP-walk the cluster with:
export MVIP="11.11.11.11"
snmpwalk -v2 -c public $MVIP -O e 1.3.6.1.4.1.38091
If at least one SNMP Trap target is configured, Python 3 fans can install these modules and test traps from the CLI to check if traps can reach the receiver(s):
- solidfire-cli==1.7.0.154
- solidfire-sdk-python==12.3.0.203
>>> import solidfire.common
>>> from solidfire.factory import ElementFactory
>>> sfe = ElementFactory.create('192.168.1.30', 'admin', 'p@ssw0rD', verify_ssl=False, print_ascii_art=False)
>>> sfe.snmp_send_test_traps()
2021-08-06 00:23:31,561 - solidfire.Element - INFO - {"method": "SnmpSendTestTraps", "id": 2, "params": {}}
SnmpSendTestTrapsResult(status='complete')
You could also use Postman or SolidFire PowerShell Tools (Invoke-SFApi -Method SnmpSendTestTraps - this is done by connecting to the MVIP, by the way. It can't be executed from a node connection).
The SolidFire SNMP test trap is SNMPv2-formatted and its source is MVIP.
SNMP v3
Here's an example of UMS configuration for SolidFire SNMP v3. Not all items are visible in the Web UI, but they are via GetSNMP method and can be set from the API, too:
- access:
rouser(default and fixed; not visible in the SolidFire Web UI) - name:
netapp - password:
NetApp123$ - passphrase:
NetApp123$ - secLevel:
auth(default, not visible in the Web UI, can be set toprivvia the API)
Having the above saved in the UI, we run GetSnmpInfo and get this back from the API:
{
    "id": 1,
    "result": {
        "enabled": true,
        "snmpV3Enabled": true,
        "usmUsers": [
            {
                "access": "rouser",
                "name": "netapp",
                "passphrase": "NetApp123$",
                "password": "NetApp123$",
                "secLevel": "auth"
            }
        ]
    }
}
Notes:
- Authentication password uses MD5
- Encryption passphrase uses DES
- Using SolidFire (Python) CLI for Linux, the equivalent command would be:
createUser netapp MD5 "NetApp123$" DES "NetApp123$"
SolidFire SNMP v3 EngineID isn't visible in the Web UI and can't be obtained via the API. To get it, in SolidFire Web UI enable SNMP v3, create an UMS user for SNMP v3, then on your client start Wireshark or tcpdump and from that client run snmpwalk to each node's MIP to find msgAuthoritativeEngineID for the node. Or try the Perl script from Appendix A. You should see something like this:
msgAuthoritativeEngineID: 80001f8880a6591019263a675f00000000
    1... .... = Engine ID Conformance: RFC3411 (SNMPv3)
    Engine Enterprise ID: net-snmp (8072)
    Engine ID Format: Reserved/Enterprise-specific (128): Net-SNMP Random
    Engine ID Data: a6591019
    Engine ID Data: Creation Time: Sep 20, 2020 19:16:54 CST
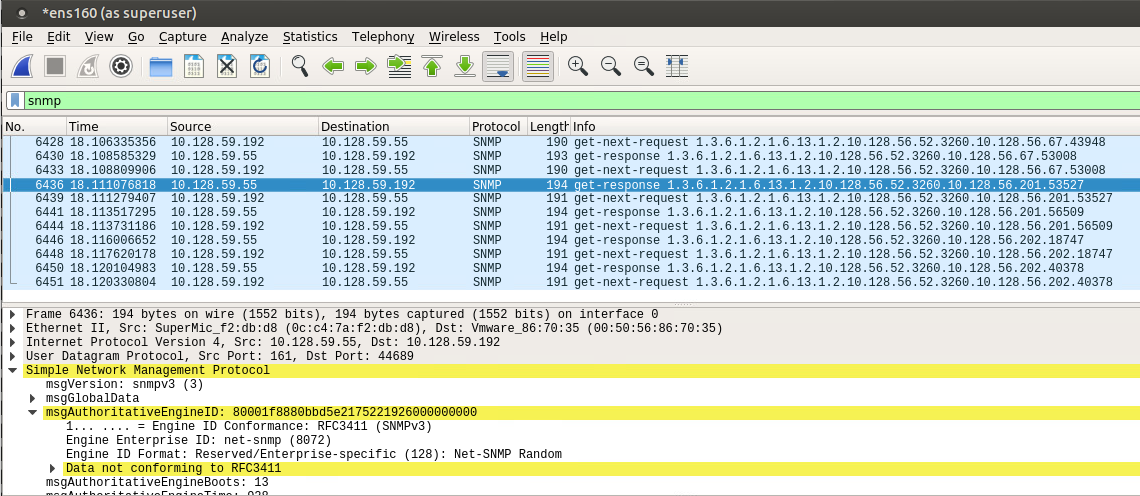
snmp.msgAuthoritativeEngineID is different on every SolidFire node.
This is an example of a minimal snmpwalk for v3:
# MVIP = 192.168.1.30, Password = NetApp123$, Passphrase = NetApp123$
$ snmpwalk -v3 -l AuthNoPriv -u netapp -a MD5 -A "NetApp123$" -x DES -X "NetApp123$" 192.168.1.30  sysName.0
SNMPv2-MIB::sysName.0 = STRING: tw1
As of 12.3, SolidFire SnmpSendTestTraps are still not using SNMP v3.
What to monitor (documentation and reference material)
This is the hardest question. Generally, I would suggest to not monitor what you have no influence over. One example that I mention is in the first video (at the bottom of this page).
- NetApp SolidFire User Guide for ActiveIQ - you can find it on a search engine or somewhere on the NetApp Web site. This UG should tell you what NetApp sees as important, so I think it's the 80% from the famous 80/20 rule.
- NetApp TR-4694 (on SolidFire performance and capacity monitoring) - you may have problems finding this one, but there's a copy right here. You can also read the SolidFire documentation, including API documentation, to see how performance, disk utilization, capacity utilization and error reporting works (but mind the fact that not everything is exposed through SNMP!)
You could also take a look at some NetApp Cloud Insights demo with SolidFire, or view sample screenshots from HCI Collector (for Grafana) or SolidFire Exporter (also for Grafana) to see what metrics they emphasize (SolidFire Exporter gets many - if not all). The last two are permissively-licensed community projects.
Events and Faults
Note that SolidFire events are many - there can be hundreds per minute. You'd probably like to just watch for trap notifications (clusterFaultNotification, clusterFaultResolvedNotification) and for faults that persist (i.e. no resolution) check the SolidFire UI or HCC or ActiveIQ.
Severity levels Critical and Error are something that should be dealt with promptly.
Example of an event with the severity level Warning (due to over-provisioned IOPS on a SolidFire Demo VM, which is capped at 3,000 IOPS):
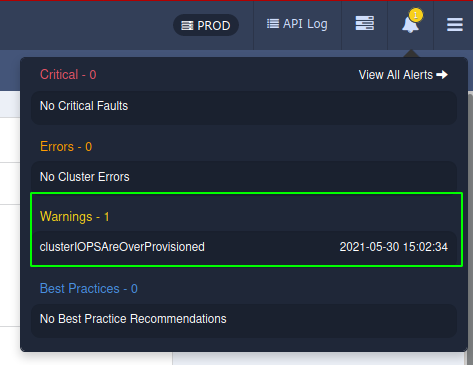
The same in SNMP Errors:
iso.3.6.1.4.1.38091.1.1.5.1.1.9.377.3155484232.1 = STRING: "clusterIOPSAreOverProvisioned"
iso.3.6.1.4.1.38091.1.1.5.1.1.10.377.3155484232.1 = STRING: "{\"blocksUpgrade\":false,\"clusterFaultID\":181,\"code\":\"clusterIOPSAreOverProvisioned\",\"data\":null,\"date\":\"2021-05-30T07:02:34.824274Z\",\"details\":\"The sum of all minimum QoS IOPS (5300) is greater than the expected IOPS (3000) of the cluster. The minimum QoS can not be maintained for all volumes simultaneously in this condition. Adjust QoS settings on one or more volumes to not exceed available cluster IOPS.\",\"driveID\":0,\"driveIDs\":[],\"externalSource\":\"\",\"networkInterface\":\"\",\"nodeHardwareFaultID\":0,\"nodeID\":0,\"resolved\":false,\"resolvedDate\":\"\",\"serviceID\":0,\"severity\":\"warning\",\"type\":\"cluster\"}"
Event Severity in clusterFaultDetails (1.3.6.1.4.1.38091.1.1.5.1.1.10)
Because cluster fault details are inserted as escaped JSON messages, to find them with grep, we would do something like this:
export MVIP="192.168.1.30" # your SolidFire Management VIP
snmpwalk -v2c -c public $MVIP -O e 1.3.6.1.4.1.38091.1.1.5.1.1.10 | \
  grep -e '"severity\\":\\"warning\\"' | grep -e '"resolved\\":false'
# another example:
# snmpwalk -v2c -c public $MVIP -O e 1.3.6.1.4.1.38091.1.1.5.1.1.10 | grep -e '"severity\\":\\"critical\\"' | grep -e '"resolved\\":true'
Different tools use different approaches to parse SNMP messages.
There are three types of severity that should be watched, so modify your filter accordingly:
- Critical
- Error
- Warning
In the SolidFire UI you may see the fourth category, Best Practices, but that was added more recently and SNMP doesn't seem to implement that event (maybe it does under another severity level - I haven't been able to find it so I'm not sure).
Event Types (1.3.6.1.4.1.38091.1.1.5.2.1.6)
I think we should simply let event severity guide our actions rather than look for individual events, but in terms of frequent event types, these are some I found in my SNMP logs:
- apiEvent - any API calls including from various CLIs and plugins such as vShere Plug-in
- clusterMasterEvent - configuration changes or other cluster changes
- driveEvent - I added this one manually; disk failures and other disk drive events
- encryptionAtRestEvent - enable, disable, set external key manager, etc.
- gcEvent - routine, Garbage Collection
- networkEvent - network-related events, may be interruptions as well
- serviceEvent - various service-related notifications
As for driveEvent, I added it manually (didn't have any in my log) because that's the one everyone wants to know about. There's no way to monitor individual disk drive events through SolidFire SNMP but, eventDriveID can call out disk ID if a drive fails or has other problem. And if you watch Warning, Error, and Critical events, you'll see it.
The complete list of SolidFire Event Types can be found in the SolidFire documentation. From that page, among the more interesting ones (that should happen extremely rarely) could be:
- csumEvent - invalid data checksum on disk
- ieEvent - internal system error
- limitEvent - too many volumes, or iSCSI connections or hitting some other cluster limit (see
Get-SFLimit) - platformHardwareEvent - hardware issues
- unexpectedException - as the name says
- ureEvent - unrecoverable read error
Again, anything that requires attention should be surfaced to your attention through Critical, Error, or Warning event severity tags - I don't think there's a need to focus on individual events.
Cluster Fault Error Codes (1.3.6.1.4.1.38091.1.1.5.1.1.9)
Examples of error codes seen in Cluster Fault messages:
- blockClusterFull - no space (you should probably delete old snapshots or unessential volumes)
- blocksDegraded - maybe recovering from disk or node or network failure
- clusterCannotSync - insufficient space to resync offline drives (NetApp KB)
- clusterIOPSAreOverProvisioned - best practice (sum of all Min's shouldn't be higher than cluster IOPS rating)
- disconnectedClusterPair - replication-related
- disconnectedRemoteNode - replication related
- driveAvailable - appears during node expansion or drive replacement
- ntpServerUnreachable - nodes should have access to NTP for consistent cluster time
- remoteRepAsyncDelayExceeded - lagging replication network
- sliceServiceUnhealthy - metadata service issues (maybe rebuilding or recovering)
- unresponsiveService - maybe a sign of overloading
- volumesOffline - volumes offline (could be to multiple concurrent node or disk failures or something else)
As you can see from that KB link (for clusterCannotSync, above, or this one) (NetApp Support login required), most if not all errors and what to do about them is documented in the SolidFire documentation, ActiveIQ or Support portal (KBs).
Performance
Like I said above, I would recommend to minimize the amount of indicators watched - it is aesthetically pleasing, but it doesn't necessarily help you manage better.
I recommend to review the documentation and external resources mentioned above, but aside from that I'll state personal preferences and opinions about counters related to performance in SNMP-based monitoring:
- Useful:
- volThrottle - this one is useful, it can highlight volumes where workload is often throttled, i.e. you may want to check top 5 throttled once a week to see if those are just unimportant workloads being throttled, or important apps that could benefit from a better Max or Burst QoS. If the volume is a datastore, maybe you don't want to be alerted all the time, but if it's a Docker ext4 or Windows NTFS volume used by only SQL Server, you'd probably want to examine QoS settings if throttling goes on for 60 minutes
- volPercentUtilization - can be used to better adjust QoS policies (downgrade volume QoS for apps that need less, give more to apps that need more) - see reference material for the details
- volClientQDepth - SolidFire caps I/O queue at 32; may appear in parallel with volThrottle, but to eliminate false warnings, maybe alert only if this persists over 30 minutes or few hours (some throttling is normal due to Max/Burst QoS or queue depth limit (32))
- Nice to have:
- volActualIOPs - may help identify busy volumes (or completely idle volumes)
- volAvgIOPSize - if you're not sure about the "average" IO size, may help you adjust QoS or alert you to the possibility of highly sequential workloads on a VMware datastore, for example
- volReadLatencyUS - not that useful unless cluster is very heavily loaded and normally goes above 2,000 us (2ms+) when workload is much higher than QoS, but can be interesting to various stakeholders
- volWriteLatencyUS - not that useful unless cluster is very heavily loaded and normally goes above 2,000 us (2ms+) when workload is much higher than QoS, but can be interesting to various stakeholders
- volTotalLatencyUS - not very actionable, but can be interesting to various stakeholders
- Non-essential:
- volBurstOPSCredit - the amount of unused Burst IOPS; it's better to occasionally check ActiveIQ for QoS recommendations (although even those may not always be correct - only you know what's right for your environment)
- volReadOps - mostly for reporting/charts, not very actionable, but can be useful to application users or other stakeholders; these are cumulative so you need to look for "per sec" delta increments
- volWriteOps - mostly for reporting/charts, not very actionable, but can be useful to application users or other stakeholders; these are cumulative so you need to look for "per sec" delta increments
- volUnalignedReads - no longer important in the context of VMs and containers
- volUnalignedWrites - no longer important in the context of VMs and containers
My main objection to trying to manage storage by following (most of) these indicators via SNMP is that without knowing QoS settings on (say) vSphere datastores, and why you set them, it's not useful to know that some volume is doing 15,000 or 150 IOPS (that doesn't tell you anything useful). On SolidFire you are unlikely to see 150 IOPS if Min QoS is 2,000, unless the application is idling.
Because of that it's usually less critical to deal with "insufficient volume performance" issues. Even throttling and client queue depth are not actionable information on their own (without knowing the context), but at least we can occasionally pick Top 5 throttled volumes and review the application stack from a holistic application and storage perspective.
One note about volThrottle vs. volClientQDepth: if Max IOPS for a volume is 1,000 IOPS, after 60 seconds of reading at 1250 IOPS or 10 MB/s this application will be throttled, but its client queue depth may remain low (5, for example). But if we attempted to use a multi-threaded application to write to that volume at 100 MB/s for 65 seconds, then we would likely fill the volume's I/O queue depth and potentially see 32 on that counter. So these two indicators may not always act consistently.
Storage Management
- Nice to have:
- volByAccountStatsAccountID - if you have more than one storage account (say, one VMware and one Kubernetes, or two VMware environments) - this lets us compare user groups in aggregate account-level terms (IOPS, capacity, efficiency, etc.) but such reports may be easier to do in ActiveIQ or with HCI Collector or SolidFire Exporter
- volByAccountStatsUnalignedReads - not very relevant except for physical servers
- volByAccountStatsUnalignedWrites - not very relevant except for physical servers
- volByAccountStatsNonZeroBlocks - used (non-empty blocks) - SolidFire volumes are thin-provisioned, so the ratio of zero blocks (below) vs non-zero blocks shows real volume fullness
- volByAccountStatsZeroBlocks - can be useful in the sense that when zero blocks divided by non-zero blocks is very low (say, 20%), it may be that discard/rethin/fstrim is not enabled (or not periodically executed, in the case of fstrim) on the client (vSphere, Windows physical server, KVM server, container, etc.) which means that eventually your volume utilization will seemingly hit 100% although the volume may be just half-full
- volByAccountStatsAccessGroups - can be interesting with several storage accounts on the SolidFire cluster, to see which VMware or Kubernetes Cluster or group of HA nodes
Cluster and Node Monitoring
This isn't a complete list but I marked only one as very useful. The reason is it there's any problem that matters, we learn of it through Events and Faults.
- Useful:
- clusterStatsPercentUtilization - if we're doing 200,000 4kB IOPS on a 4-node H610S (100K/node) cluster, this counter should show 50 (%). Because volumes are automatically balanced for both capacity and performance across all cluster members, it makes sense to watch just one, cluster-wide performance utilization counter
- Non-essential:
- nodeStatsClusterBytesIn - bytes are always coming in or going out and when they don't, we get cluster-level faults, so not particularly interesting
- nodeStatsClusterBytesOut - same as above, but may be useful when monitoring SolidFire's Backup-to-S3 traffic
- networkUtilizationCluster - same as above (this is for Management interface aka Cluster Management Network)
- networkUtilizationStorage - same as above (this is for iSCSI interface i.e. Storage Network)
- nodeStatsStorageBytesIn - same as above
- nodeStatsStorageBytesOut - same as above, but may be useful when monitoring backup or replication traffic
- nodeStatsMgmtBytesIn - not very actionable and when it stops we get cluster-level faults anyway
- nodeStatsMgmtBytesOut - not very useful, there's always bytes coming in In or going Out
- nodeStatsCpuUtilization - not very useful; SolidFire nodes have enough CPU power to deliver promised throughput, storage efficiencies and storage maintenance (GC runs once an hour and there are automated background tasks which also consume CPU resources), so there isn't much we need to do with this information
- nodeStatsUsedMemory - same as above, not very actionable - SolidFire appliances have enough RAM for their rated performance, and we can't add more even if we wanted to; RAM utilization goes up and down based not just on workload but also internal jobs
We can use some of these counters to compute useful indicators. One example is (volByAccountStatsNonZeroBlocks / (volByAccountStatsZeroBlocks + volByAccountStatsNonZeroBlocks)), another would be the sum of all volumes (SolidFire 12.3 supports up to 400 actively used iSCSI volumes per node).
It seems there's no way to monitor cluster storage fullness (not directly at least), which is something that would be very useful, but as you get closer and hit various levels of fullness (there's several), you get a Warning (or later Error, and Critical) severity event as those happen.
So just make sure you watch Warning, Error and Critical events as they compensate for the lack of some SNMP counters related to storage capacity.
Walk-Through: AdRem NetCrunch with NetApp SolidFire
Configuration
Here are some example screenshots from one of SNMP monitoring applications I like, NetCrunch (runs on Windows).
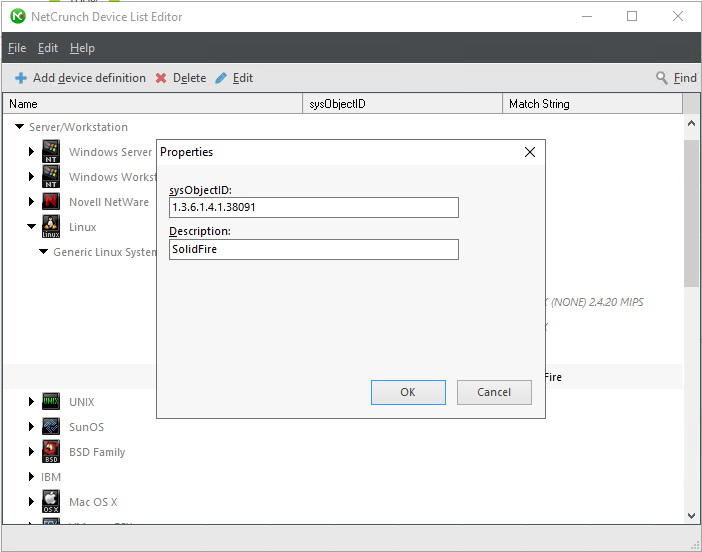
You can add SolidFire nodes as generic Linux nodes, but you can also provide your own icons, etc.
NetCrunch has an easy-to-use SNMP Manager that lets you add and compile SolidFire MIBs. After compiling, you can browse the details in NetCrunch SNMP Manager:
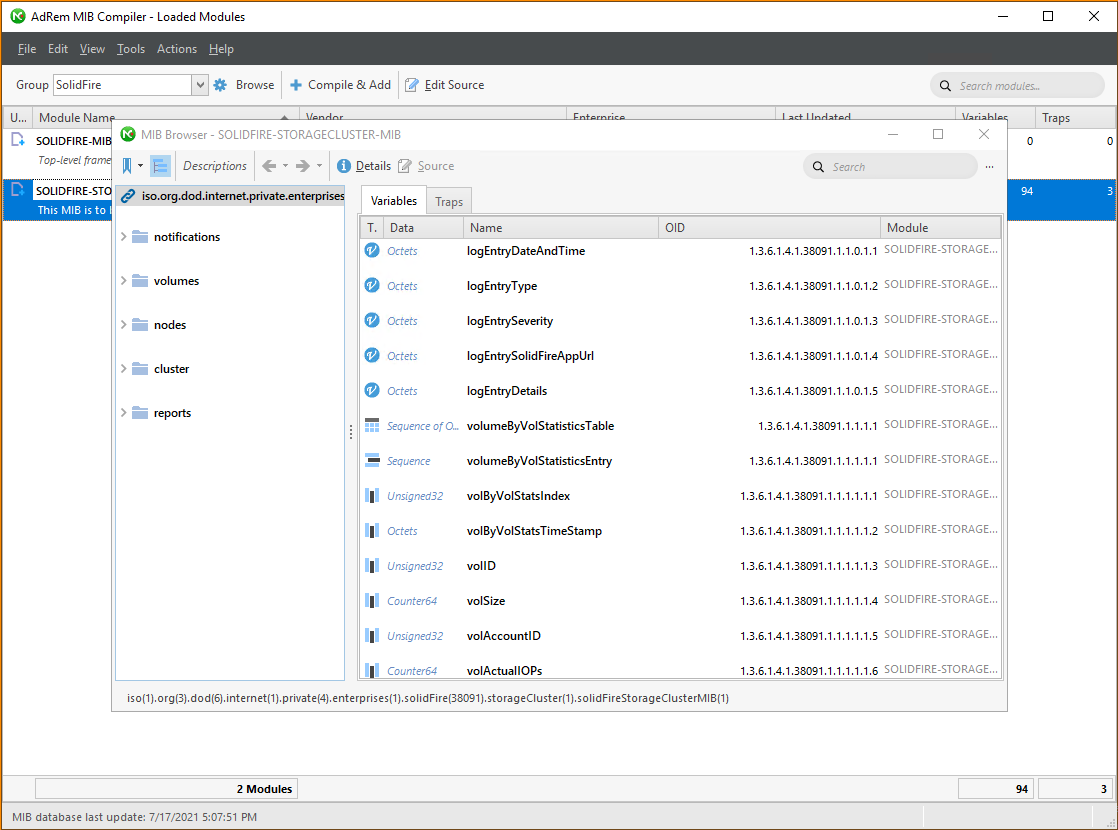
These correspond to the five categories from the table at the top of this post.
SNMP Events (Errors and Events) vs. SNMP Traps
If you watch errors and events via "pull" (snmpwalk), you'd always consider Errors:
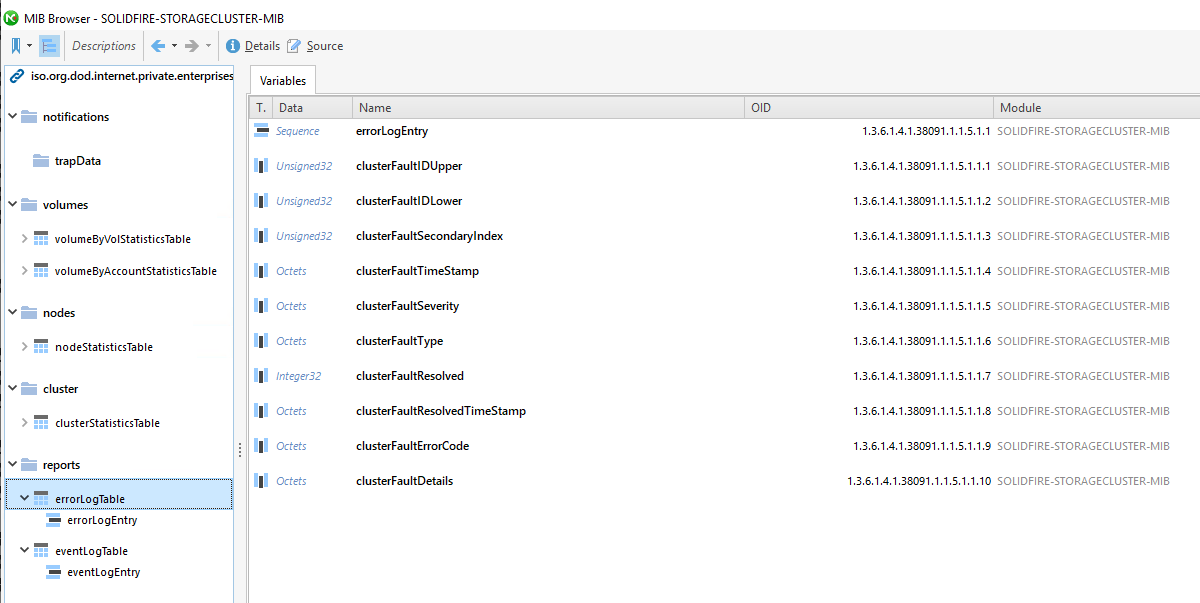
Errors are the first table from "Group 5" (from the table at the very top of this page). The second table from Group 5 is Events:
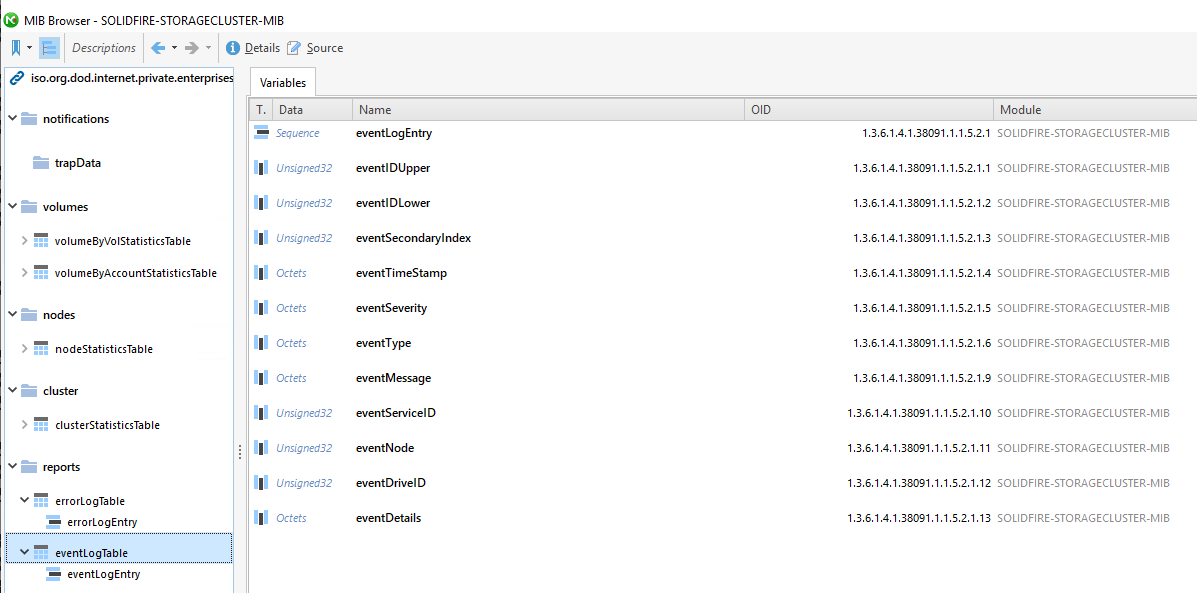
Group 0 has just one section - notifications - which are delivered as SNMP Traps:
SNMP Performance Monitoring
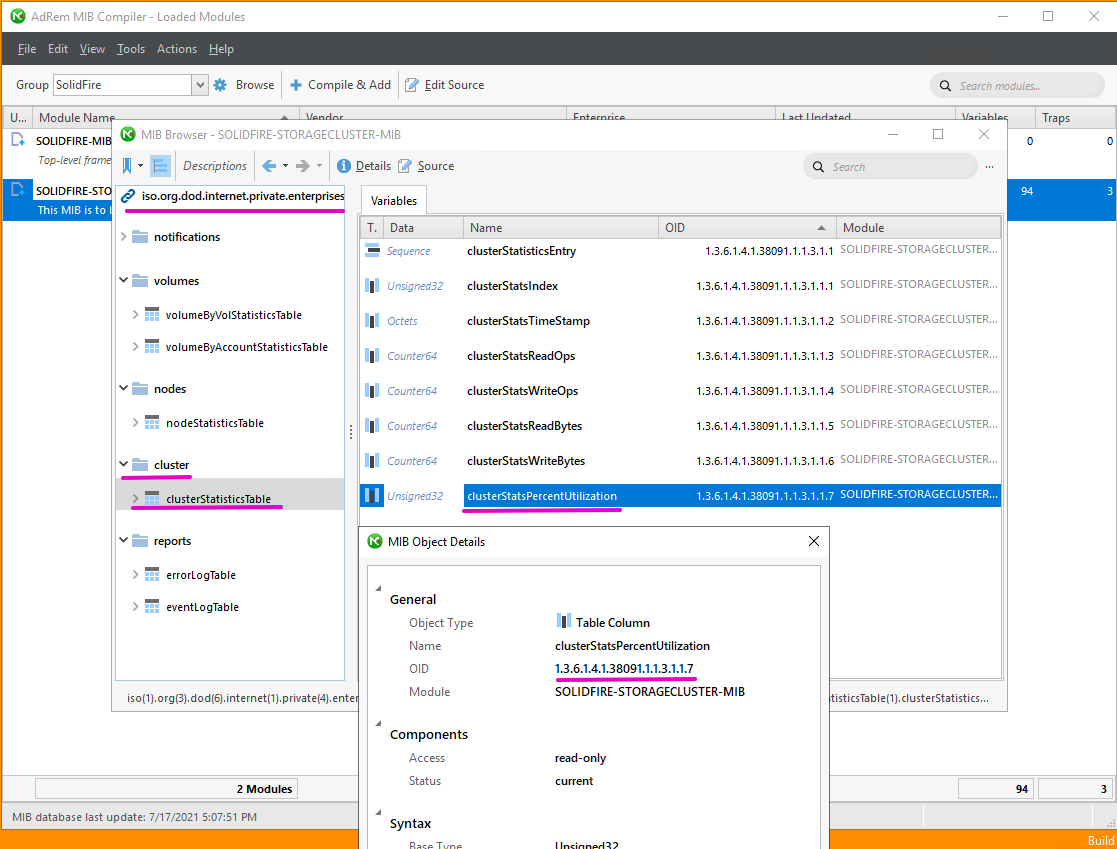
Cluster utilization (%) is one of the useful SNMP performance indicators:
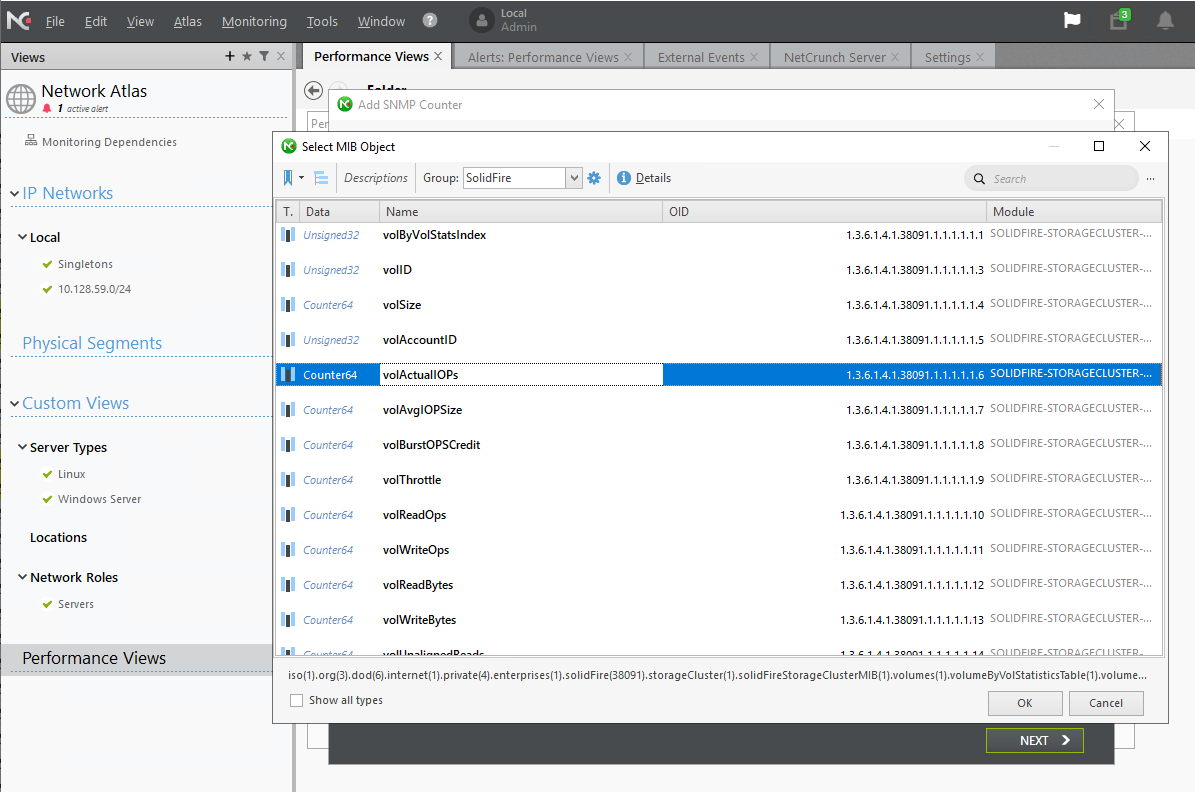
To monitor IOPS on a Volume ID, first find and pick the counter you're interested in:
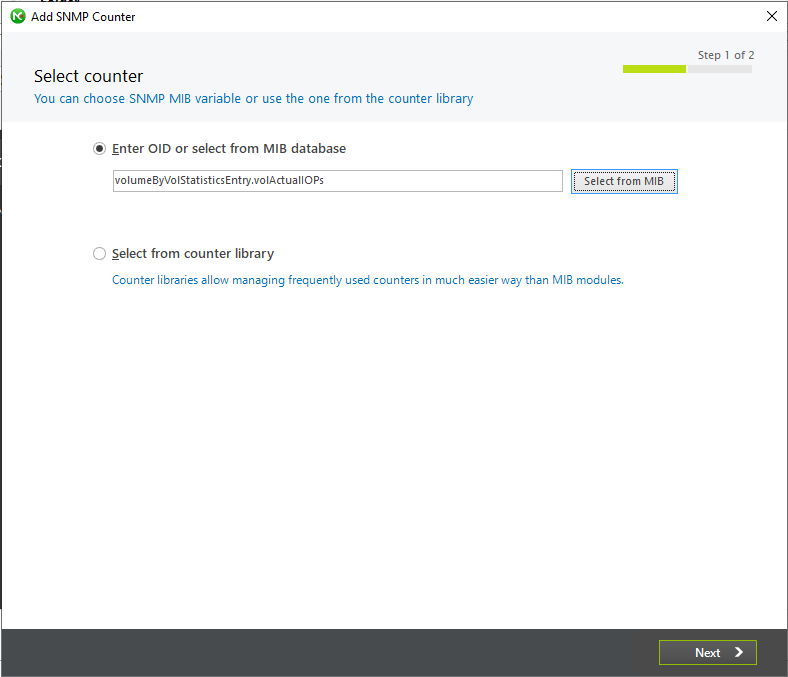
Add the counter to the list of monitored counters:
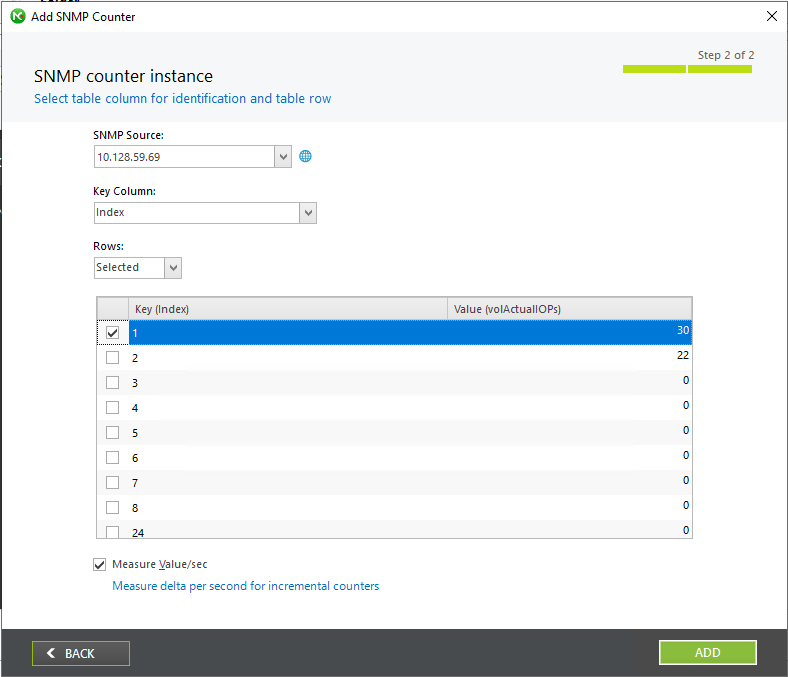
Pick a Volume by its Volume ID: you can identify the desired IDs in the SolidFire Web UI. By default, many NetApp HCI customers have volume IDs 1 and 2 used for vCenter and mNnode (HCC) VMs, for example. On this cluster, those two are present and lightly utilized.
SolidFire SNMP and NetCrunch will also let you obtain various Linux SNMP counters, but to me that's just unnecessary data, not necessary information. I would recommend against showing more than the absolute minimum you need to efficiently manage your storage services with least amount of work.
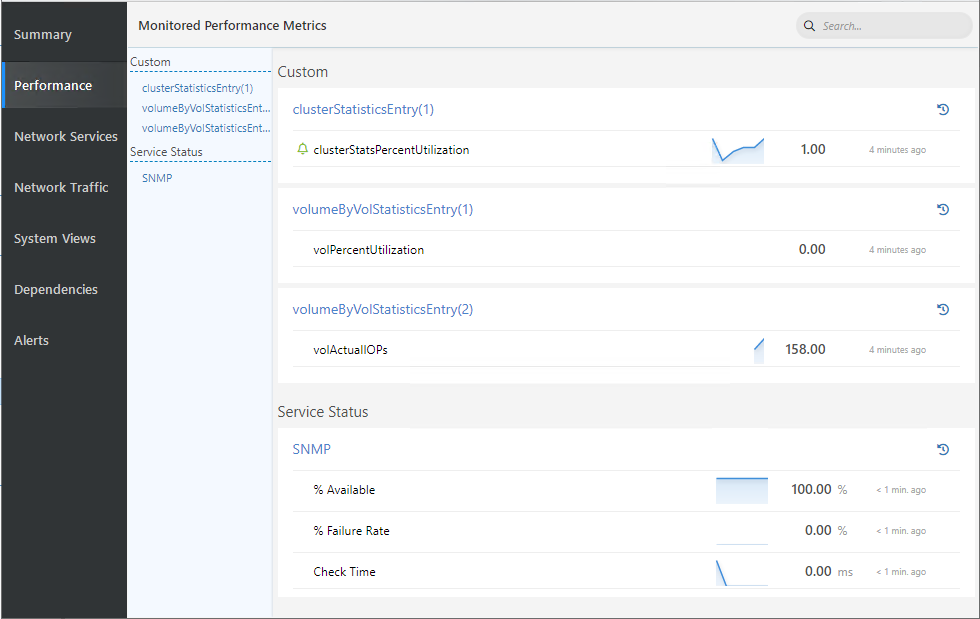
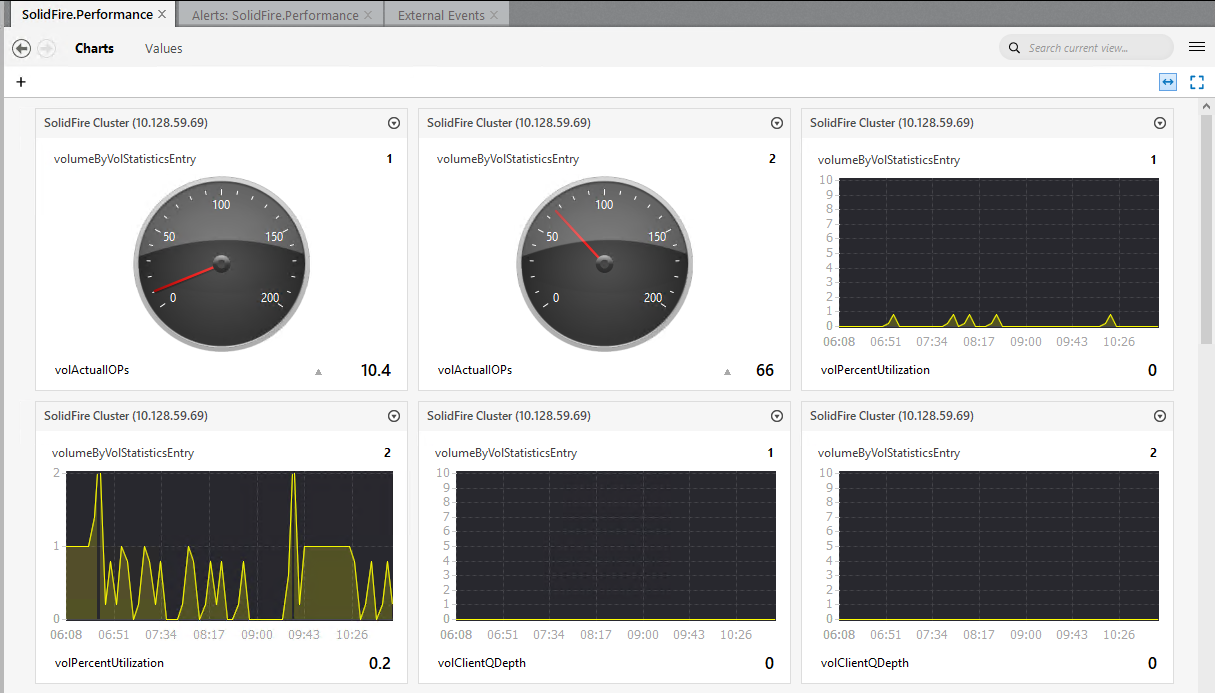
This screenshot shows three indicators; cluster utilization and two volumes (volume IDs 1 and 2, which contain vCenter, mNode and few other infrastructure VMs):
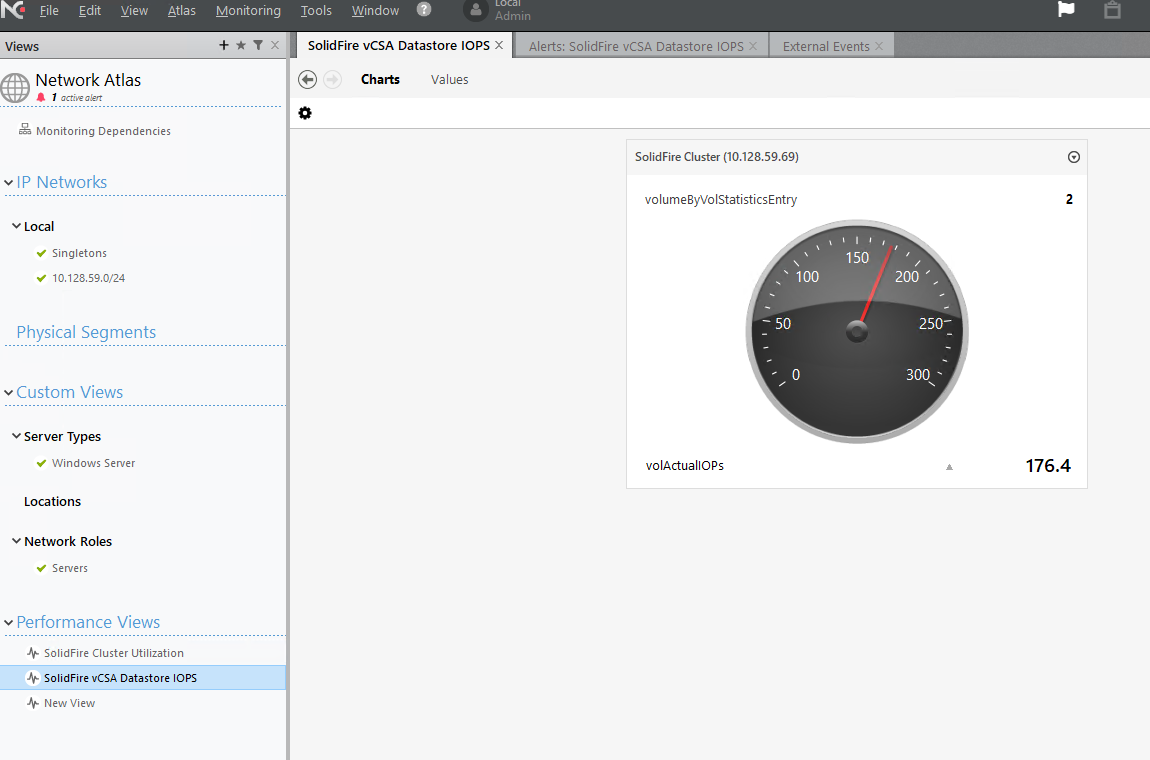
You can also create these in the performance view. Example of a volume IOPS gauge for Volume ID 2:
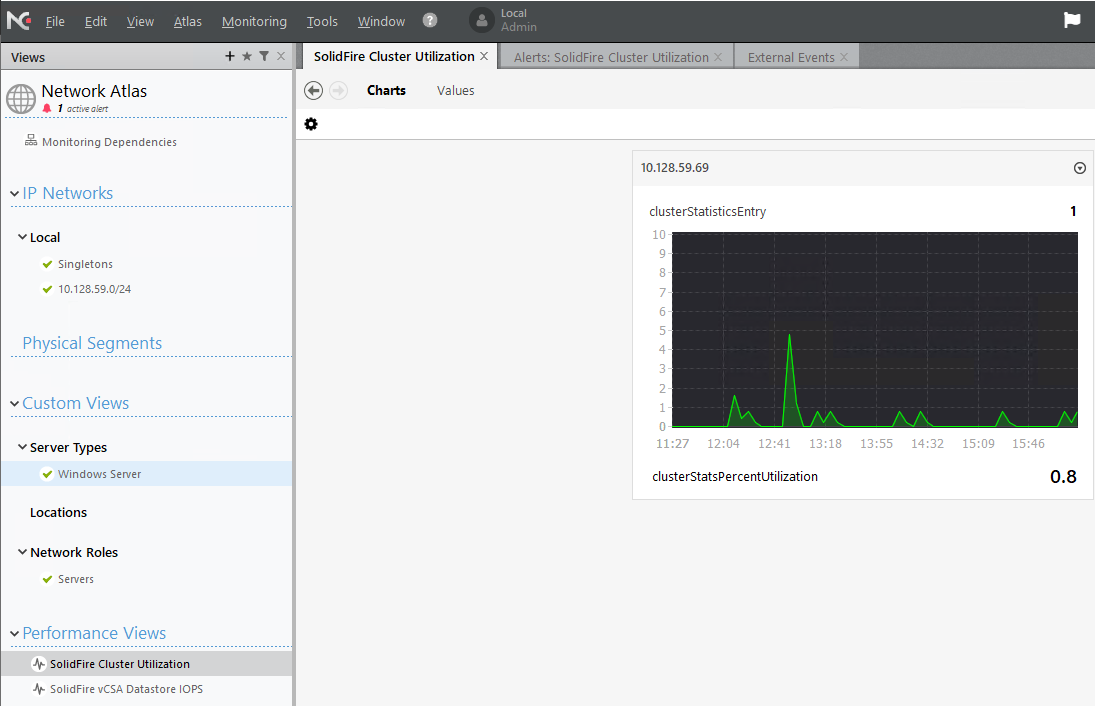
Example of cluster utilization chart:
A version with multiple performance counters on the same page. We use gauges and charts. There's a small amount of IO on volume IDs 1 & 2 with volume utilization slightly more pronounced on volume ID 2; both volumes have an empty I/O queue:
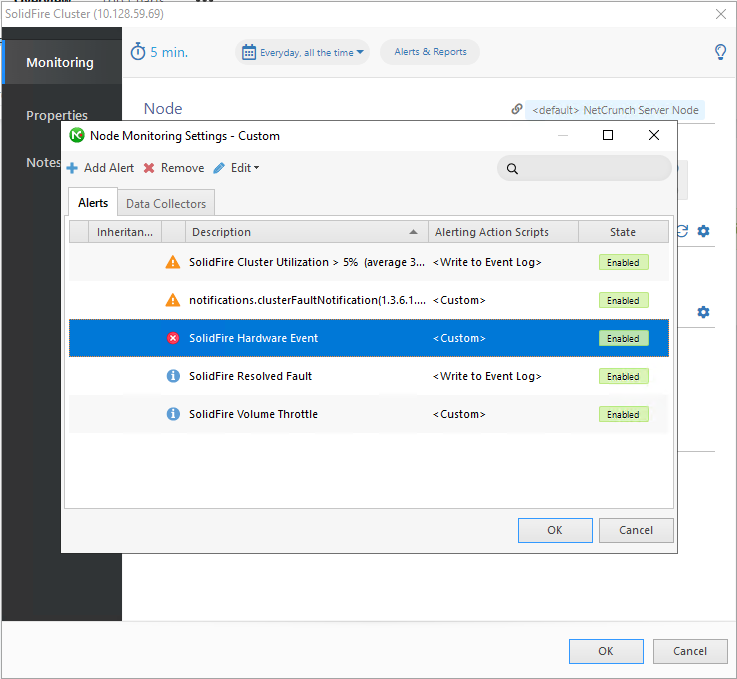
Alerts for performance, SNMP variable values and Cluster errors/events
This segment illustrates how to set up alerts for errors/events, various SNMP values, and SNMP performance counters.
Examples of how these could be used:
- Informational: volumeThrottle (i.e. volume hitting its Maximum IOPS) - on any change in throttling % value, log it; we can analyze logs periodically to see if any changes may be necessary. This may create a lot of activity so I'd use it just for few important volumes at first
- Warning: warn when clusterStatsPercentUtilization > 90%, if we're concerned about hitting 100%; if this warning appears often maybe we should add another node or adjust QoS policies
- Critical: any SolidFire event where event severity equals any of: warning, error, critical. For these we can perform multiple follow-up actions depending on our requirements (UI alert, log, email, Webhook - depending on the management software and integrations)
Once an alert kicks in, NetCrunch will show something like this:
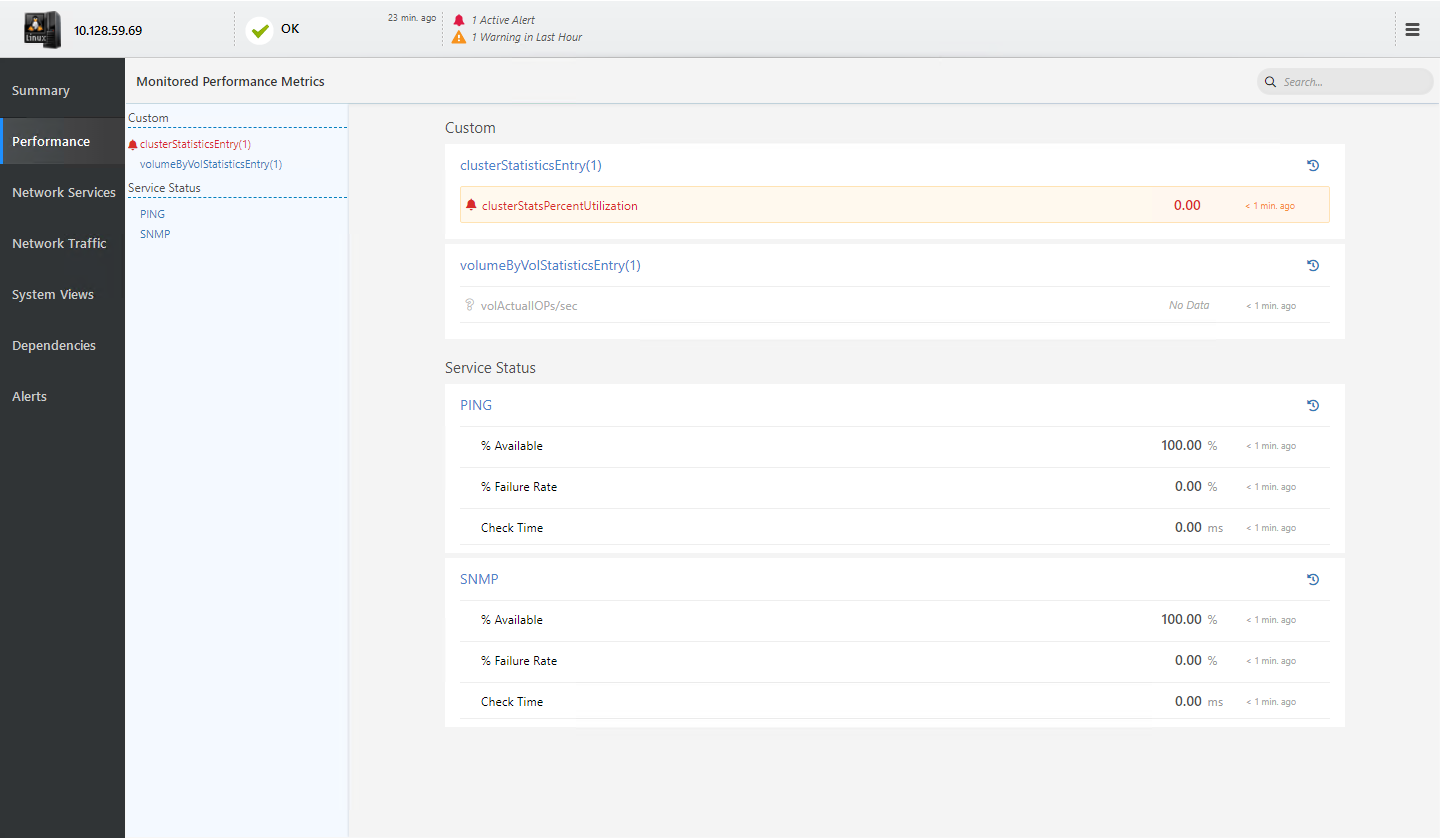
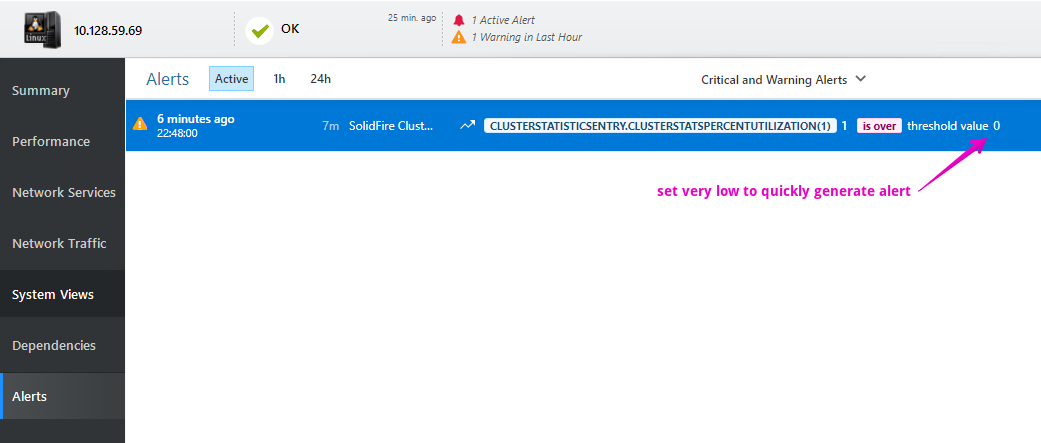
In this example below, cluster utilization hit the limit (to trigger this alert instantly, I set it to activate at > 0% utilization):
NetCrunch can self-acknowledge an alert when the fault is resolved. Example: the cluster utilization drops below a certain level (say, the average of 3 samples < 1 %; in real life I'd probably use the average of 3 consecutive samples < 75%)
snmpwalk for Cluster Errors and Events
As you generate alert condition on SolidFire in order to test your work, watch the alert appear in the SolidFire UI (the first screenshot in this post), then check Reporting > Event Log and Reporting > Alerts in the SolidFire Web UI and try to see what those map to in SNMP.
As an example, using my SoldiFire Demo VM (example from the top) we first look for unresolved faults, then find what that fault is.
Please make sure you test your alerts in pre-production by temporarily pulling a network cable (one at a time, with 30s in between!), for example.
When I ran snmpwalk against MVIP looking for unresolved faults, I found this:
$ snmpwalk -v 2c -c public -Os $MVIP 1.3.6.1.4.1.38091.1.1.5.1.1.7 | grep false
clusterFaultResolved.377.3155484232.1 = INTEGER: false(2)
$ snmpwalk -v 2c -c public -Os $MVIP iso.3.6.1.4.1.38091.1.1.5.1.1.9 | grep "clusterFaultErrorCode.377.3155484232.1"
clusterFaultErrorCode.377.3155484232.1 = STRING: "clusterIOPSAreOverProvisioned"
$ snmpwalk -v 2c -c public -Os $MVIP iso.3.6.1.4.1.38091.1.1.5.1.1.10 | grep clusterFaultDetails.377.3155484232
# JSON string in FaultDetails has been shortened - full version without escape characters can be found further below
clusterFaultDetails.377.3155484232.1 = STRING: "{\"blocksUpgrade\":false,\"clusterFaultID\":181,\"code\":\"clusterIOPSAreOverProvisioned\"...}"
What are these OIDs?
$ snmptranslate -m+ALL 1.3.6.1.4.1.38091.1.1.5.1.1
SOLIDFIRE-STORAGECLUSTER-MIB::errorLogEntry
$ snmptranslate -m+ALL 1.3.6.1.4.1.38091.1.1.5.1.1.7
SOLIDFIRE-STORAGECLUSTER-MIB::clusterFaultResolved
$ snmptranslate -m+ALL 1.3.6.1.4.1.38091.1.1.5.1.1.9
SOLIDFIRE-STORAGECLUSTER-MIB::clusterFaultErrorCode
$ snmptranslate -m+ALL 1.3.6.1.4.1.38091.1.1.5.1.1.10
SOLIDFIRE-STORAGECLUSTER-MIB::clusterFaultDetails
The shortened JSON message from SOLIDFIRE-STORAGECLUSTER-MIB::clusterFaultDetails (iso.3.6.1.4.1.38091.1.1.5.1.1.10) is shown here, in the case you're curious. I formatted this as valid JSON (with escape characters inserted in SNMP message removed) to make it easier to read.
{
	"blocksUpgrade": false,
	"clusterFaultID": 181,
	"code": "clusterIOPSAreOverProvisioned",
	"data": null,
	"date": "2021-05-30T07:02:34.824274Z",
	"details": "The sum of all minimum QoS IOPS (5300) is greater than the expected IOPS (3000) of the cluster.
  The minimum QoS can not be maintained for all volumes simultaneously in this condition.
  Adjust QoS settings on one or more volumes to not exceed available cluster IOPS.",
	"driveID": 0,
	"driveIDs": [],
	"externalSource": "",
	"networkInterface": "",
	"nodeHardwareFaultID": 0,
	"nodeID": 0,
	"resolved": false,
	"resolvedDate": "",
	"serviceID": 0,
	"severity": "warning",
	"type": "cluster"
}
This clusterFaultDetails value is what SolidFire services log, and what you get in SNMP Traps as well. The SolidFire Web UI, Events and Faults would show same information.
IMPORTANT: when creating SNMP filters for alerts, make sure you insert proper escape characters if necessary! JSON message above is proper JSON, but in SNMP error message that be more like:
\"code\":\"clusterIOPSAreOverProvisioned\"...
Whether you need to escape certain characters or not depends on what software or command you use. As you can seen from the screenshots below, I didn't have to escape anything when creating filters in NetCrunch, but when I used grep in Linux (see above) I had to.
So that is how we get SolidFire errors and events with snmpwalk!
In order to get "push alerts" from SNMP when a fault occurs, we would use SNMP Fault Traps (to learn of new fault traps) and similarly, to learn about resolved issues (SNMP Resolved Fault Traps).
SNMP Traps: Cluster Fault Trap and Cluster Resolved Fault Trap examples
Here's how I created a working set of SNMP Trap-based alerts for the above cluster fault (overprovisioned IOPS), but I made it generic enough to capture other, similar faults.
My objective was to create two generic alerts:
a) Alert on every new cluster fault - failed disk, pulled network cable, etc.
b) Alert on every resolved cluster fault - replaced disk, reconnected network cable, etc. For b) I want information-type alert, so that I don't get too stressed about it.
I first added individual SolidFire storage nodes (appliances) to a separate group of monitored hosts. For that group, I created rules for Cluster Fault Trap and Cluster Resolved Trap notifications and instructed NetCrunch to raise a warning when the following alert rules are met.
Cluster Fault Trap
For new faults I wanted to try two approaches:
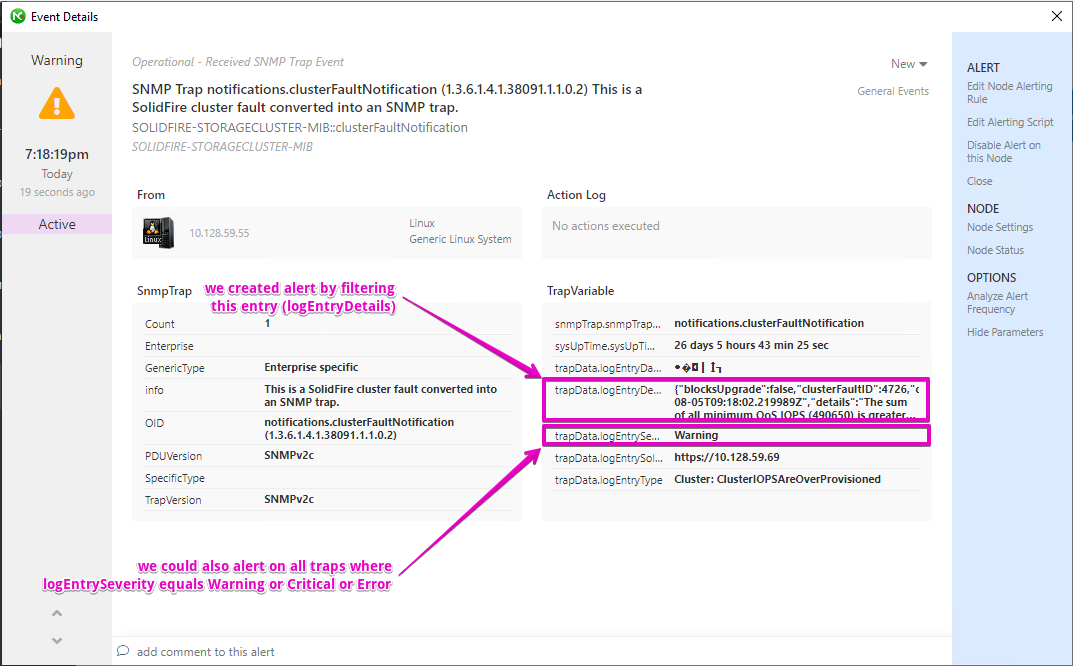
- Approach 1 that filters only logEntryDetails: filter embedded JSON messages (see the nicely formatted JSON example above) for combinations of certain key-value pairs, such as
"severity": "warning" - Approach 2 which relies for logEntrySeverity for severity info: here we look at the value of logEntrySeverity (and raise alert if the value is one of Warning, Error,Critical) to determine severity
For alerts I'll configure the both (so I'll get two alerts per new fault), but normally we'd chose just one.
Here's how we could do it in Approach 1: raise alert when all of the following conditions are met: severity is warning or error or critical AND resolved is False.
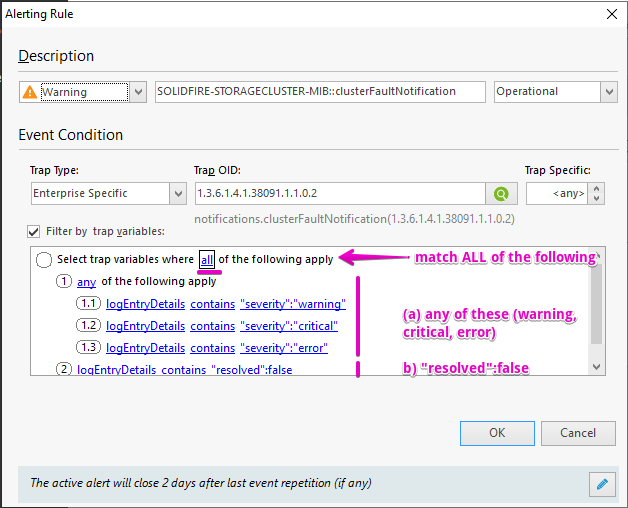
With this I will capture all new faults from SNMP Traps.
In Approach 2, I can get the same outcome by simply matching values in logEntrySeverity. Notice the case difference: it's warning in JSON (logEntryDetails) vs. Warning in logEntrySeverity!
We still need to look for "resolved": false as that detail is only available in logEntryDetails!
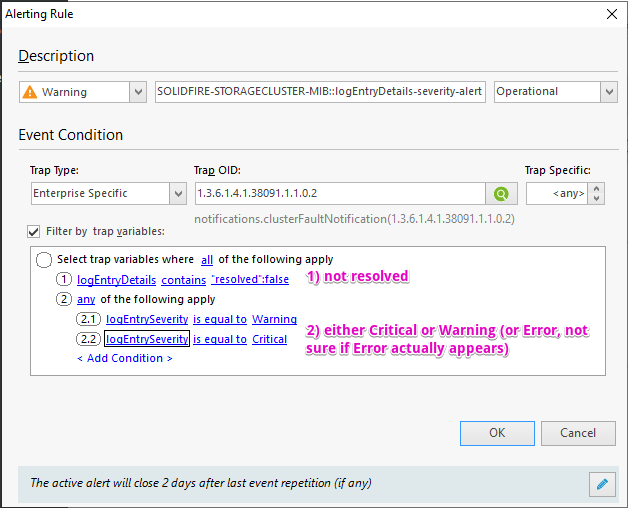
notifications.clusterFaultNotification (SNMP Trap, OID iso.3.6.1.4.1.38091.1.1.0.2) was used for this and also in the next example.
$ snmptranslate iso.3.6.1.4.1.38091.1.1.0.2
SOLIDFIRE-STORAGECLUSTER-MIB::clusterFaultNotifications
Cluster Resolved Fault Trap
Create exactly the same rule as for new fault, but with two differences:
- Instead of
"resolved": false, match on"resolved": true- we want to be notified when a fault is resolved - Instead of alerting a bunch of people and causing several minor heart attacks in the process, we choose a milder action such as "Informational Alert"
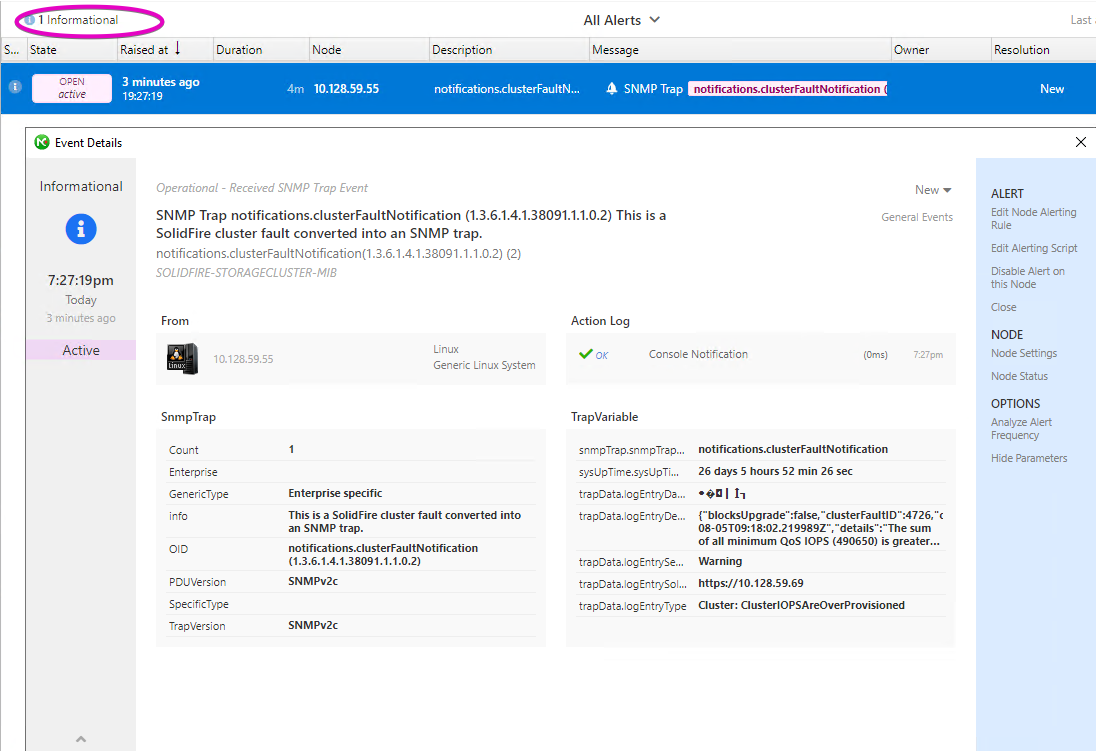
Apply group filters to SNMP Traps from all SolidFire nodes
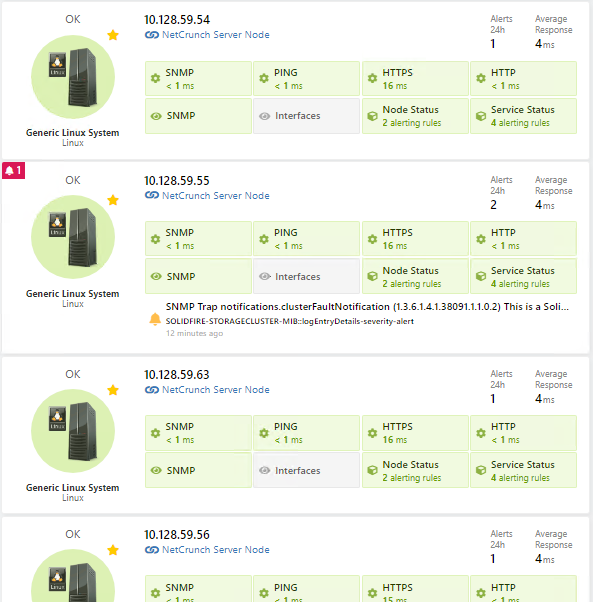
SNMP Trap rules and actions were applied to all SolidFire appliances. SNMP Traps with Cluster Faults come only from one node (current Cluster Master) which in my case was this node (x.x.x.55). But any node can become Cluster Master, so you need to access to SNMP Trap port to all nodes.
To generate a new cluster fault, I edited a SolidFire QoS policy rule to bloat total provisioned Min IOPS over cluster Maximum IOPS, and less than a minute later I got an alert (examples above).
As you can see, cluster fault alerts reach NetCrunch (SNMP Trap destination/recepient) from Management IP of current SolidFire Cluster Master node.
I acted on that alarm by assigning it to a storage or automation specialist. Depending on your tool you could automate this in different ways.
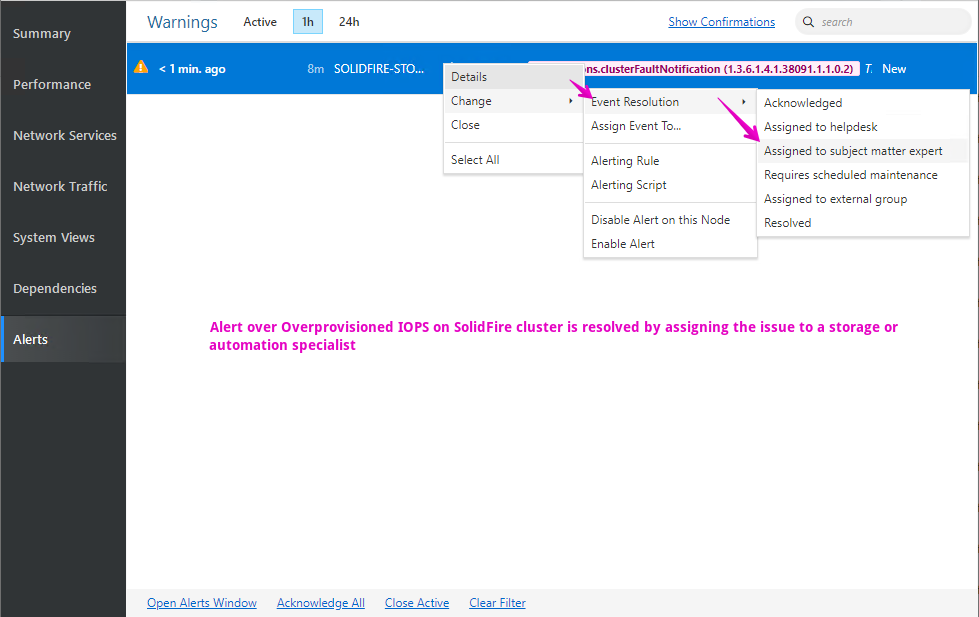
That person happens to be me, so I went back to the SolidFire UI and adjusted the offending QoS policy. Seconds later my next alert fired up: informational message about a resolved cluster fault! (golf clap)
Loose vs. strict rules
We could build advanced alert-matching rules based on Cluster Fault Error Codes (1.3.6.1.4.1.38091.1.1.5.1.1.9) for a more precise & automated issue classification and assignment system, but that would be slightly more work in terms of configuring alert conditions. With this we could alert the network admin for network-related (DNS, NTP, link down) issues and the storage admin about cluster capacity hitting 75%, for example.
Personally I would prefer to keep the rules coarse (if not always, then at least initially): if it's a Warning, or Error, or Critical event and not resolved, alert me. If it's the same severity but Resolved, only log or inform/notify me. With that you should be able to capture everything you need.
As an example, here's what my alerts (Approaches 1 & 2) from Cluster Fault Trap section caught this morning: network issues with node node5:
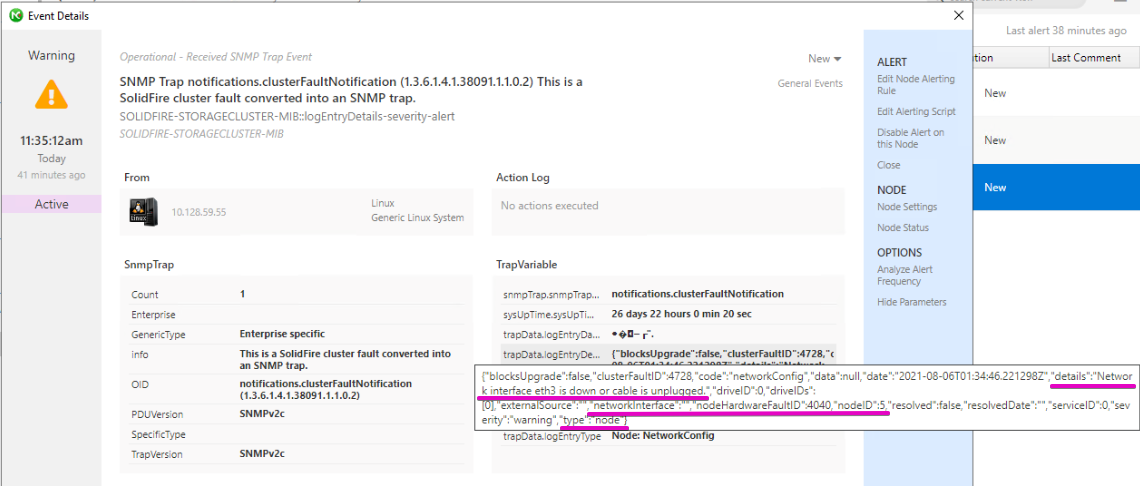
Notice that severity=warning and resolved=false. That's how and why it matched our filters from Approach 1.
But also notice that type=node (not type=cluster), and nodeID=5, which is great - we are able to capture useful node fault with the same rule originally aimed at capturing overprovisioned IOPS on the cluster.
We could get fancy and create a spin-off rule that adds an AND condition that says if details=Network interface, and then alert only network admin(s) rather than all admins, but I'd rather use one generic filter and decide what to tune by looking at monthly alerts at the end of every month. In SNMP Traps, Approach 2 (with logEntrySeverity) requires slightly less typing when filters are created, but both approaches can be used to create fine-tuned alert filters if need be.
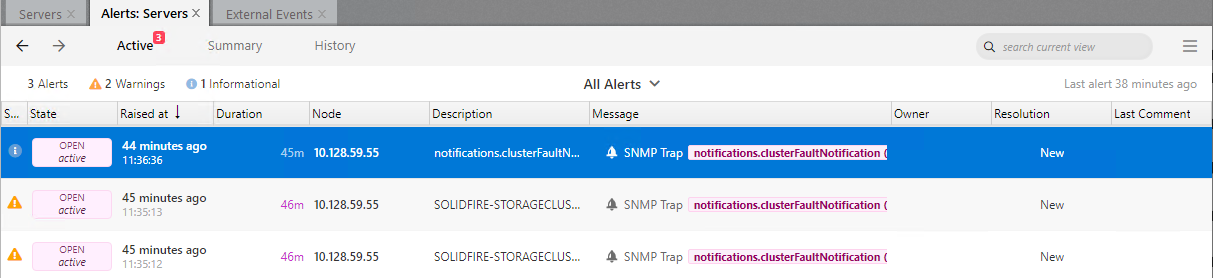
Next day, when I logged in to NetCrunch I found two new fault alerts (the fault triggered both alerts designed for Approaches 1 & 2) and one informational "fault resolved" alert - all of the rules matched perfectly even though this was a node-level network issue. (It looks like the switch may have been rebooted.)
Conclusion
- Review ActiveIQ and TR-4694 (or the SolidFire Admin Guide and API documentation) for the details on what is commonly monitored.
- SolidFire SNMP counters (as you can see in the MIB files) don't have everything that is available through the SolidFire API. In addition to that, some "analytics" insights require more than one compute operation which may be hard to do in SNMP applications. Because of that it makes sense to:
- Focus on the important and available, such as (1) cluster faults (especially severity levels Warning, Error and Critical), (2) cluster utilization, (3) volume QoS and queues
- Offload complex and advanced analytics and reporting to other tools (e.g. SolidFire Exporter, ELK, etc.)
- Many monitoring applications provide not just SNMP, but various other means of integration including plugins, Webhooks or scripts. For some tasks it very easy to integrate those rather than rely on SNMP (especially when, like in this case, not everything is available via SNMP). In the case of SolidFire it literally takes a 10 line script to create a reliable PowerShell or Python script to check on something. Example: basic SolidFire plugin for Nagios that I keep alive for reference purposes.
Demo
- Note: screenshots in this post have been improved after videos were created, so they are better and more correct than what you can see in the videos
Appendix A
Get SNMP v3 EngineID with Perl (no Wireshark) (source):
#!/usr/bin/perl

use strict;
use warnings;
use Net::SNMP;
use Data::Dumper;

my $hostname = '192.168.1.30'; # IP or hostname
my $username =  'netapp';
my $authpasswd = 'NetApp123$';
my $authproto = 'MD5';
my $privpasswd ='NetApp123$';
my $privproto = 'DES';

my $port = '161';
my $maxmsgsize = '1472'; #range (484..65535)

(my $session, my $error) = Net::SNMP->session(
                            -hostname      => $hostname,
                            -port          => $port,
                            -version       => 3,
                            #-community    => $community,   # v1/v2c
                            -username      => $username,    # v3
                            -authpassword  => $authpasswd,  # v3
                            -authprotocol  => $authproto,   # v3
                            -privpassword  => $privpasswd,  # v3
                            -privprotocol  => $privproto,   # v3
                            -debug         => '0x10',
                            -maxmsgsize    => $maxmsgsize,
);

if (!defined $session) {
printf "ERROR %s.\n", $error;
exit 1;
}

for (my $i=1; $i<10; $i++){
    print Dumper($session->get_next_request(-varbindlist => ["1.3.6.1.4.1.38091.$i"]));
}
Output:
$ perl /tmp/sf.pl| grep -i engine
debug: [989] Net::SNMP::Security::USM::_engine_id_discovery(): engineID = 0x80001f8880a6591019263a675f00000000
error: [1065] Net::SNMP::PDU::_report_pdu_error(): Received usmStatsUnknownEngineIDs.0 Report-PDU with value 29
error: [299] Net::SNMP::MessageProcessing::prepare_data_elements(): Received usmStatsUnknownEngineIDs.0 Report-PDU with value 29
error: [398] Net::SNMP::Dispatcher::_transport_response_received(): Received usmStatsUnknownEngineIDs.0 Report-PDU with value 29
error: [2520] Net::SNMP::__ANON__(): Received usmStatsUnknownEngineIDs.0 Report-PDU with value 29 during discovery