EPA 4 development update
Introduction
E-Series Performance Analyzer (EPA) was originally created by NetApp, which stopped maintaining the project more than four years ago.
There was no signficant community activity around it, so I forked the project and have been maintaining it by myself for over three years now.
Although EPA has always been performance-focused, it had some out-of-scope features such as MEL collection which is in EPA even now although it's probably too heavy for a performance-gathering project. After I forked EPA, I eliminated SANtricity Web Services Proxy right away, made EPA CLI- and Kubernetes-ready, added a Prometheus exporter and made some minor changes like the addition or removal of this or that metric.
Last year I started experimenting with gathering additional, configuration-related details in what was meant to become EPA 4. But as that new version was becoming complete, it also became large and very unlike EPA, so it was moved to a separate project (E-Series SANtricity Collector, ESC). The idea was to keep improving ESC and keep EPA 3 focused on performance metrics.
But I've received zero feedback or bug reports for ESC, which makes it an easy decision: I won't update it. EPA 3 can now progress to version 4 without merging with ESC, while keeping EPA 3 features and adding some configuration-related information and approaches that work well in ESC.
What's changing and what's not
What's changing:
- Prometheus-only output: EPA 4 will have only Prometheus output, and database (InfluxDB) output will be dropped. ESC has had modern InfluxDB Core 3 support with AI-assisted natural language queries from day one and it worked really well. It appears those who monitor array configuration to that level and larger scope also prefer to use vendor's or enterprise management tools, and those who run smaller systems simply use array's Web UI. Therefore, there's no reason to bring InfluxDB 3 to EPA, especially when existing performance metrics are already available in Prometheus output and basic configuration details can be added to Prometheus exporter.
- Light configuration details-only: key configuration details that EPA 3 keeps in InfluxDB 1 will be exposed through Prometheus metrics in EPA 4. Prometheus isn't the right tool for that, but it appears good enough. Another reason is among the three kinds of array data that can be collected - performance metrics, configuration and event logs - I'd rather focus on performance and events (maybe in another project).
- Live performance metrics-only: these are already available in EPA 3 (with "
-realtime", which is off by default), but will become the only option in EPA 4 because averaged metrics (or "analysed" performance metrics, as they're called in SANtricity API) often confuse users: they're coarse, may seem stale depending on collection interval, there is now realtime ("live") option which has slightly different metrics so dashboards can't be exactly the same or need to be modified, etc.. I still think live metrics aren't needed for most users and just bloat database, but multiple options make both the "analysed" and live option bad. - Simplicity: with Prometheus exporter as the only available output, there is no strict need for a fixed database option - Prometheus metrics can be scraped by dozens of tools and inserted into any database. My Grafana recipes will default to Prometheus data source. That means simplicity, fewer bugs, smaller EPA footprint and easier integration.
- Prometheus alerts: they are already available in EPA 3, but most users go with the defaults, don't enable Prometheus output, they stick with the defaults (InfluxDB and Grafana). Since MEL is being removed, "active failures" metric from EPA 3 Prometheus will be added. Additional Prometheus alerts may be added at a later time.
- Differentiation and "E-Series First" focus: the "tech" behind fetching JSON-formatted responses and showing them in Grafana is simple. Everyone does that part the same way. But, not everyone wants to focus on the same inputs or outputs, so there's plenty of room for unique, E-Series-focused innovation.

Dashboards
This month I've fully implemented EPA 4 with InfluxDB Core 3.9.0 (including porting all reference dashboards from existing EPA 3) and also another version, with Prometheus-only output. Prometheus-only approach in EPA 3 looked good enough and database output was dropped and v3.6.0 with Influx Core 3 was never published.
These sample dashboards below aren't supposed to impress or showcase - they demonstrate the Prometheus-only approach works well. They are shared to save time to those who want to reuse them. These screenshots can be opened in a new tab for a detailed view, by the way.
First, the "Overview" dashboard. This dashboard shows overall status of an E-Series storage system and main subsystems - controllers, interfaces, volumes, pools and physical disk drives.
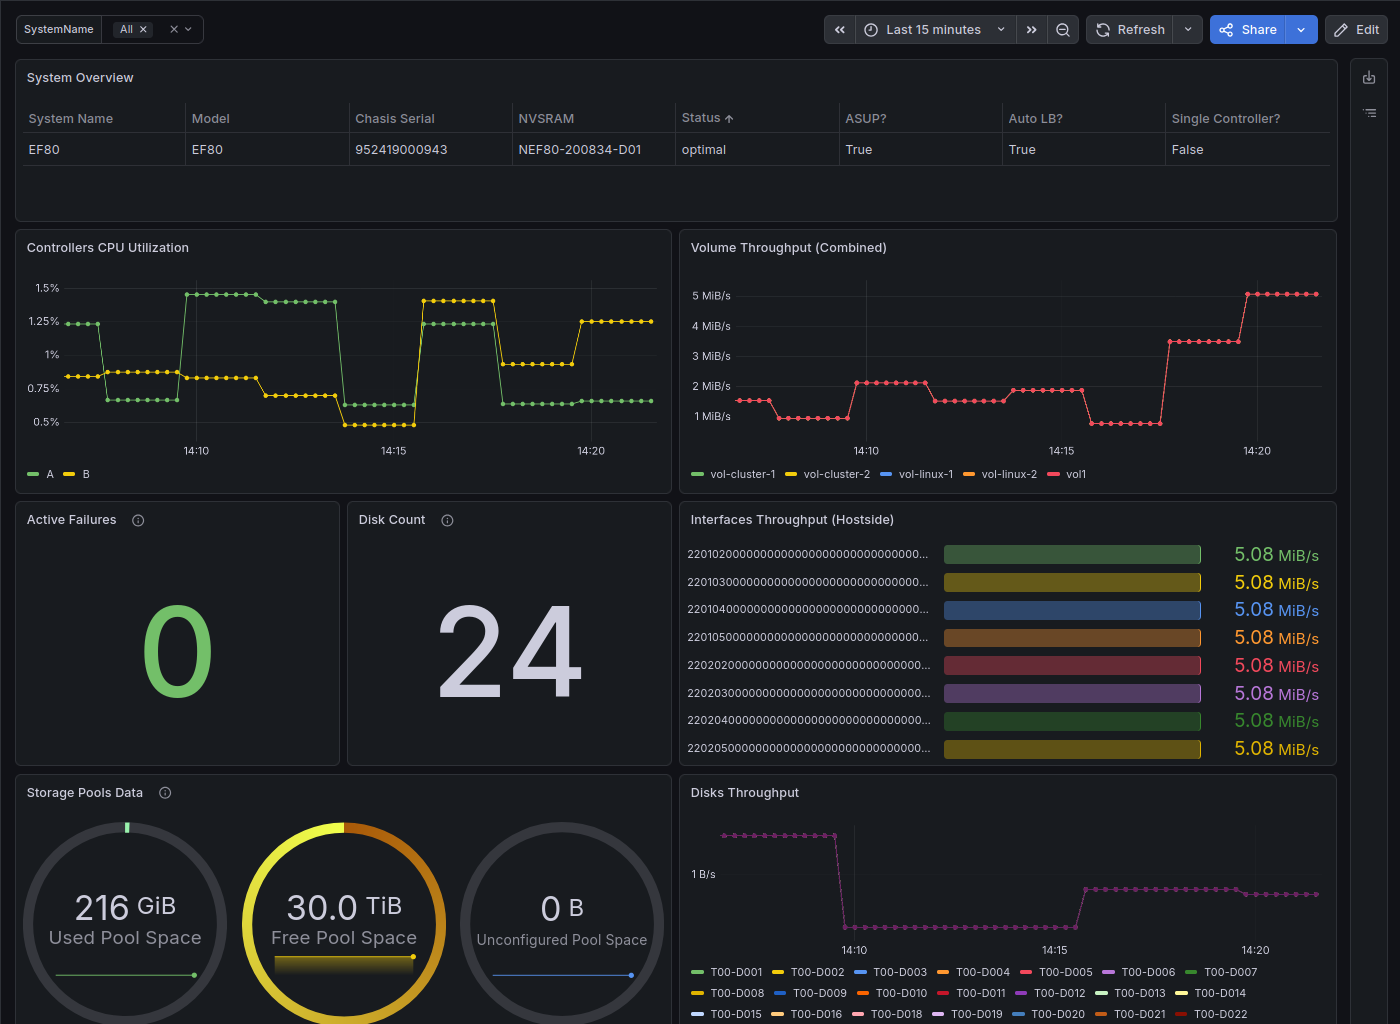
This demonstrates that "config" details are "dashboardable", as you can see at that table at the top (storage system details) and the two "stat" panels with the number of active failures (the main thing to inform us of current issues, since MEL collection has finally been kicked out of EPA) and physical disk count.
The Volumes dashboard has the usual stuff - latency, IOPS, throughput. All of these are "live" metrics, so if you collect at 60s interval, these get updated once a minute.
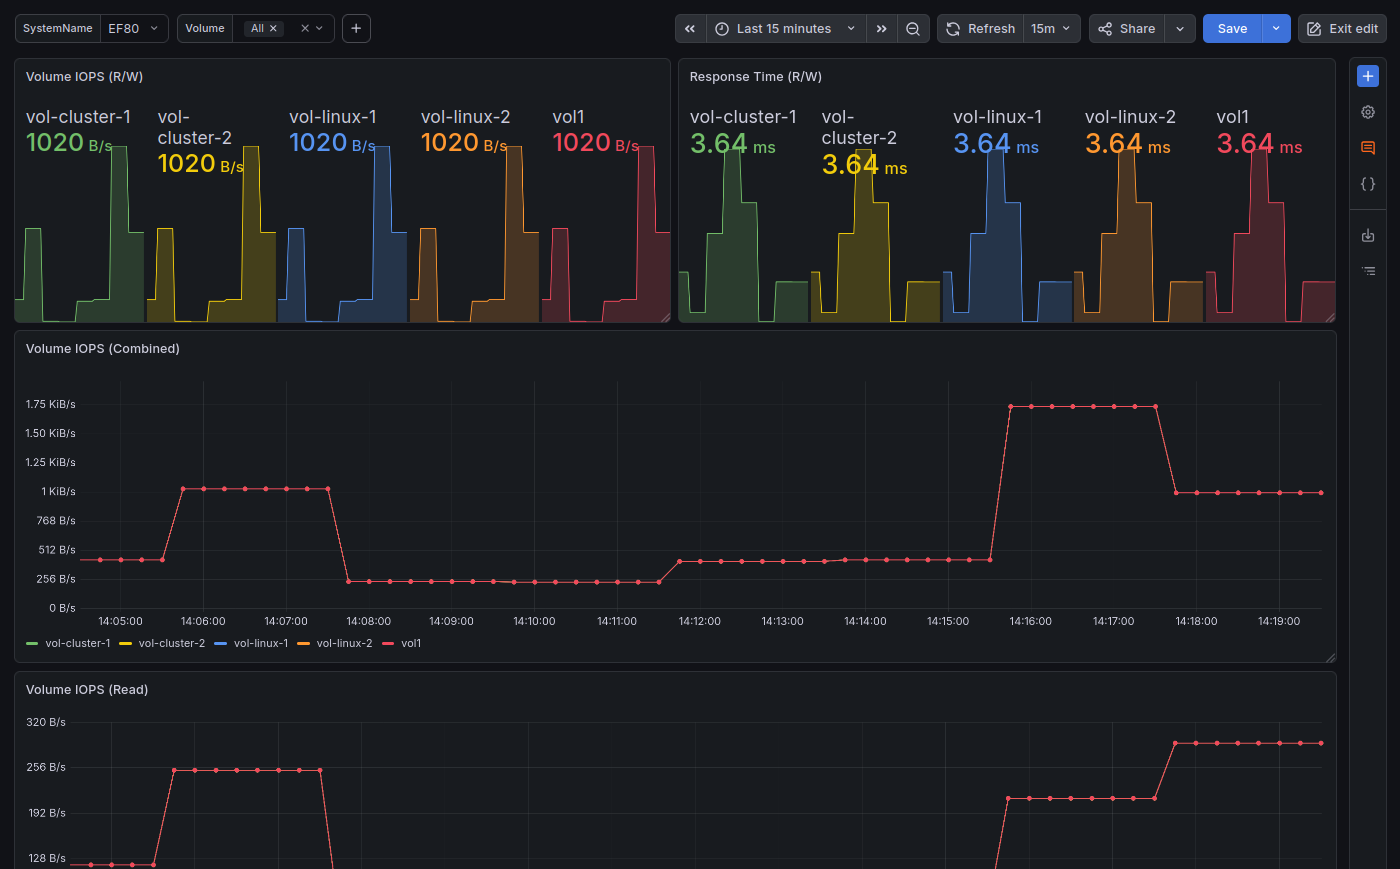
The bottom of the Volumes dashboards shows that "config" style tables for volumes are also "dashboardable" - there are volumes and storage pools details at the bottom.
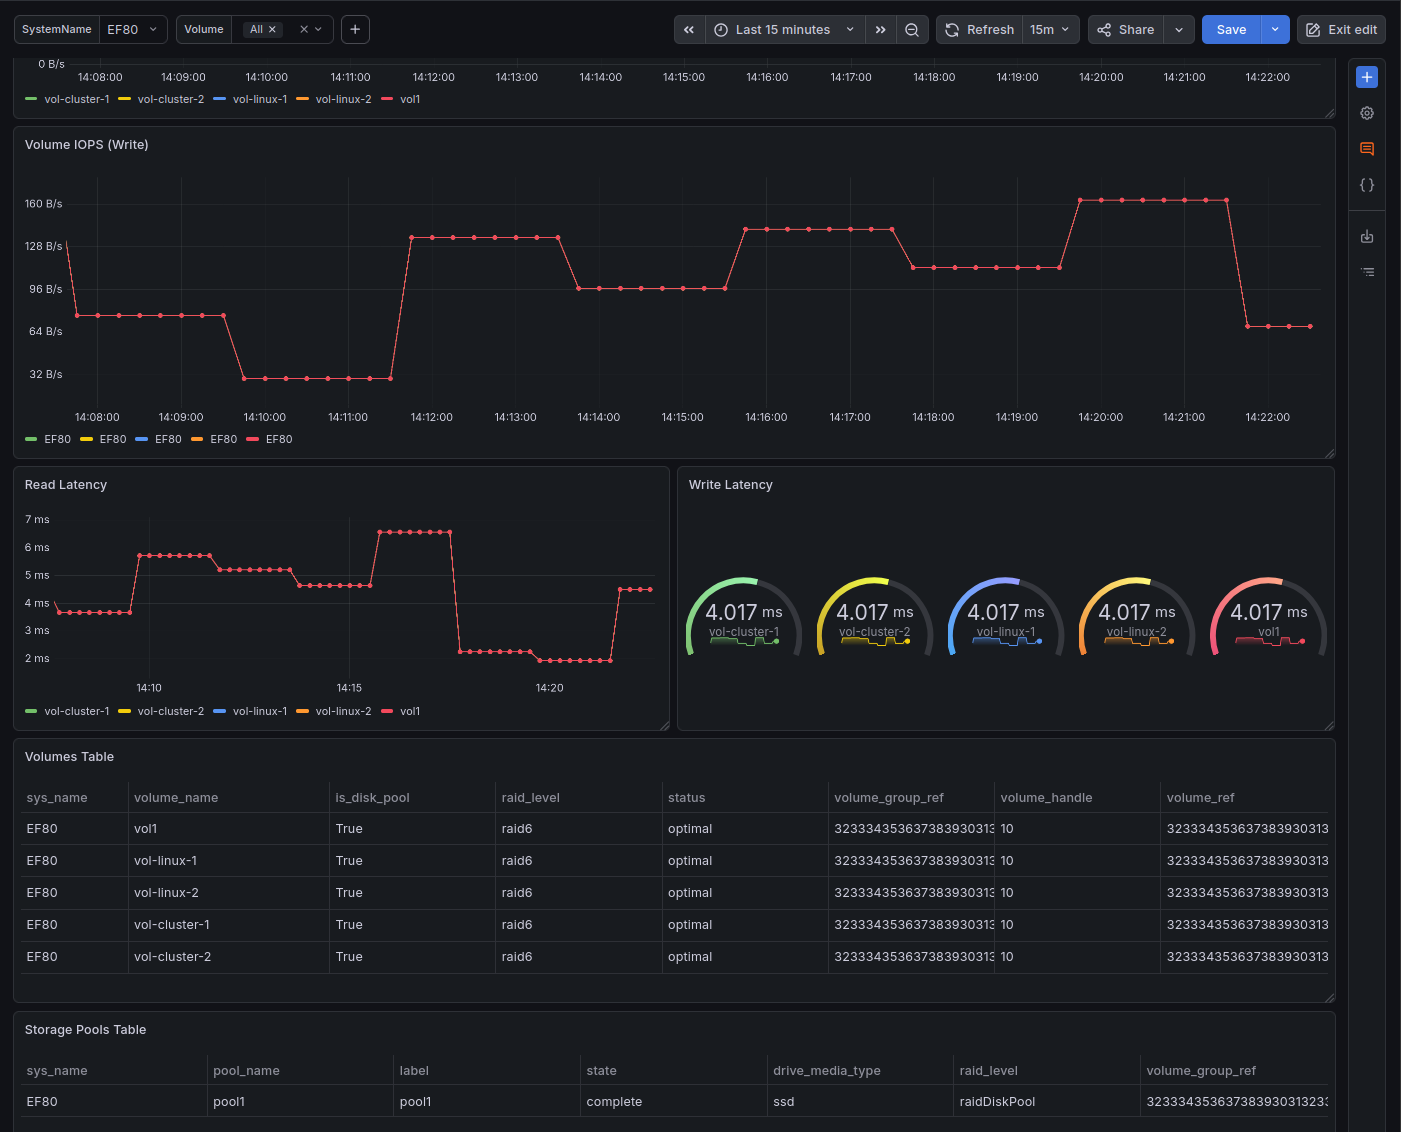
The Storage Pools dashboard below doesn't showcase config details (since there's already a pools panel in the Volumes dashboard just above), but has a drop-down storage pool selector which lets you view per-pool performance metrics. We usually look at volume performance metrics rather than aggregate pool-level performance, but I like to have that option here.
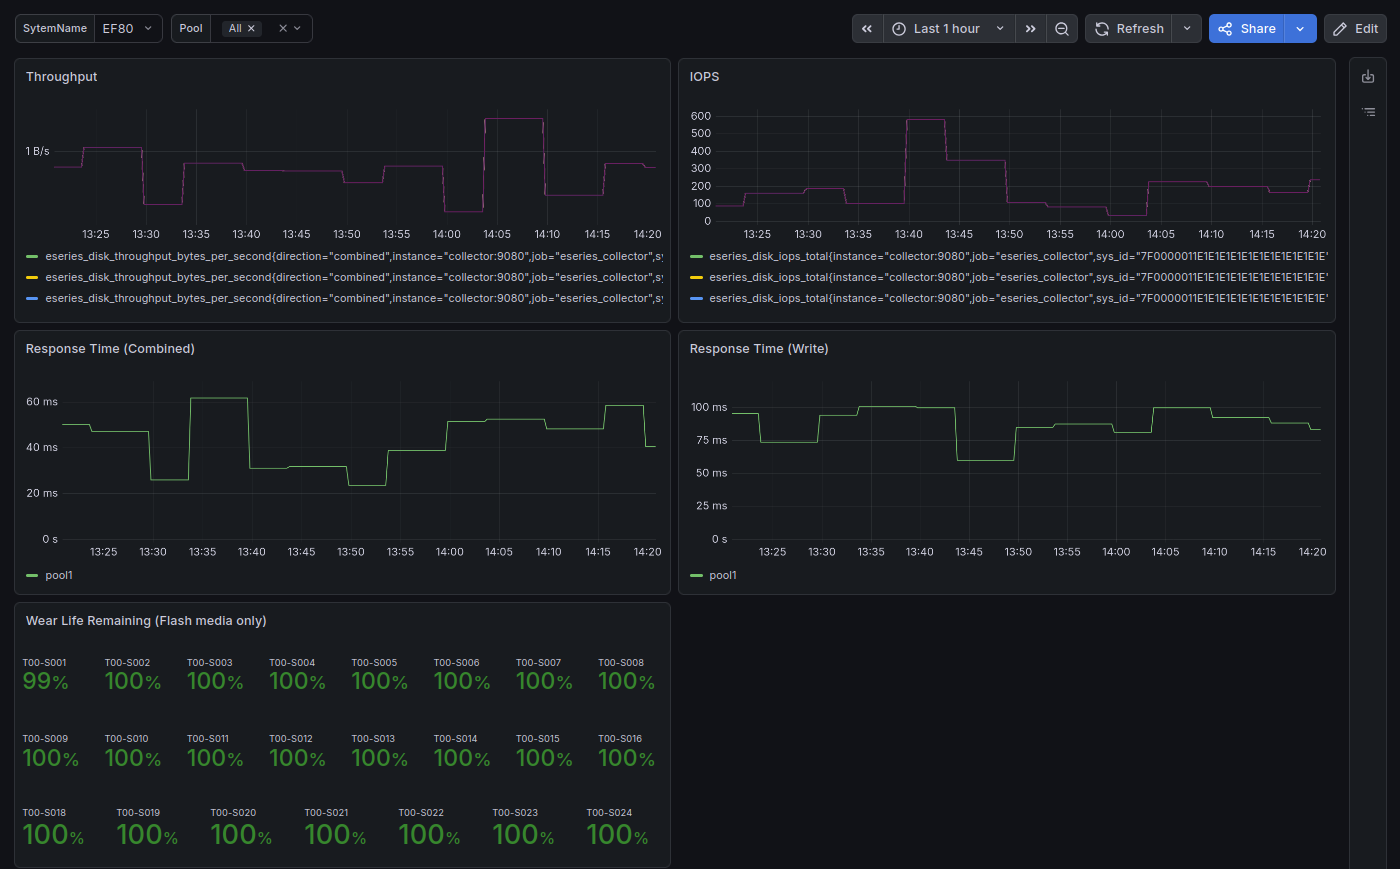
At the bottom of that Storage Pools dashboard we have a seemingly misplaced "disk drive"-related panel with SSD wear level. It's available in the Storage Pools reference dashboard because we can see pool-level information for disks. Of course, it can be moved or duplicated to any other dashboard.
The Interfaces dashboard doesn't really do much new in terms of performance monitoring compared to EPA 3. These four panels show how the same information can be visualized in time series, gauges or "stat" panels.
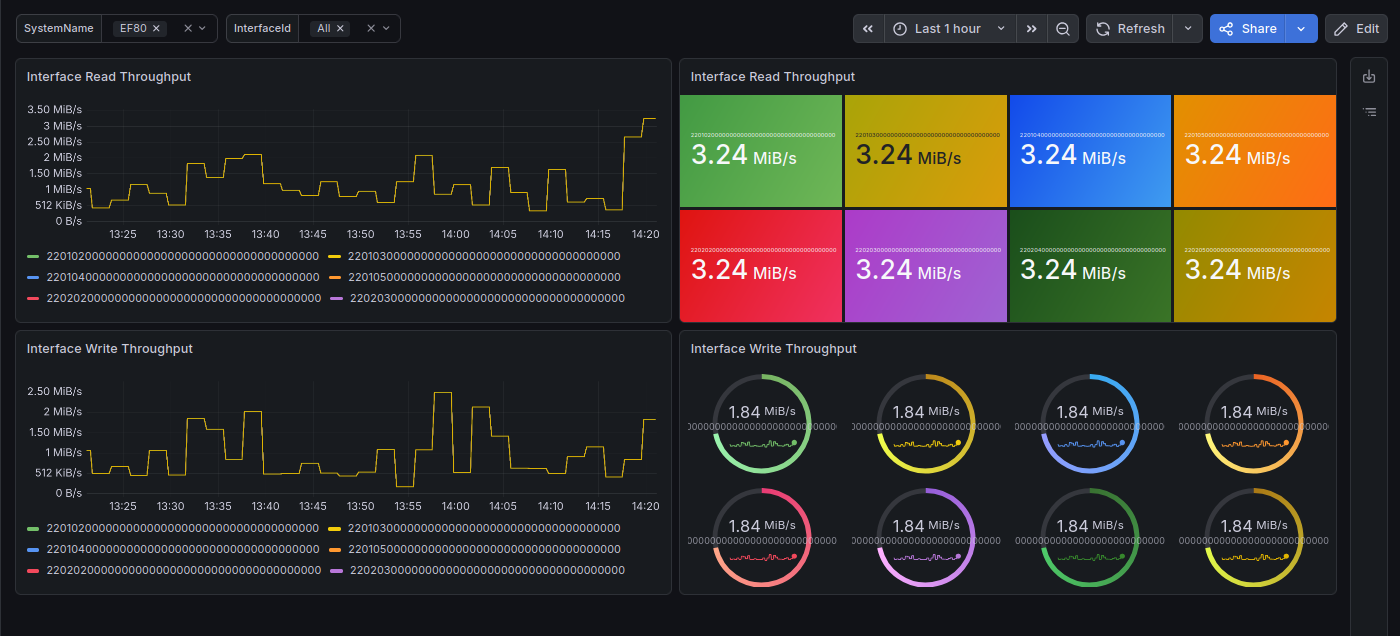
There's no configuration table example for interfaces, but the recent post about updates in SANtricity Client library shows that is likely to be much better than in EPA 3. SANtricity interface IDs (they have no native labels) are still hard to distinguish, but they can be easily aliased by users based on own needs. The issue with doing that by default in EPA is there are many interface configurations - both in terms of number and types - so without access to a variety of hardware or support logs, it's hard to do.
The last example is about snapshots and linked clones. If you're interested in this topic, you should also read that post about SANtricity Client library (link above) because that explains why EPA 4 is able to do that well.
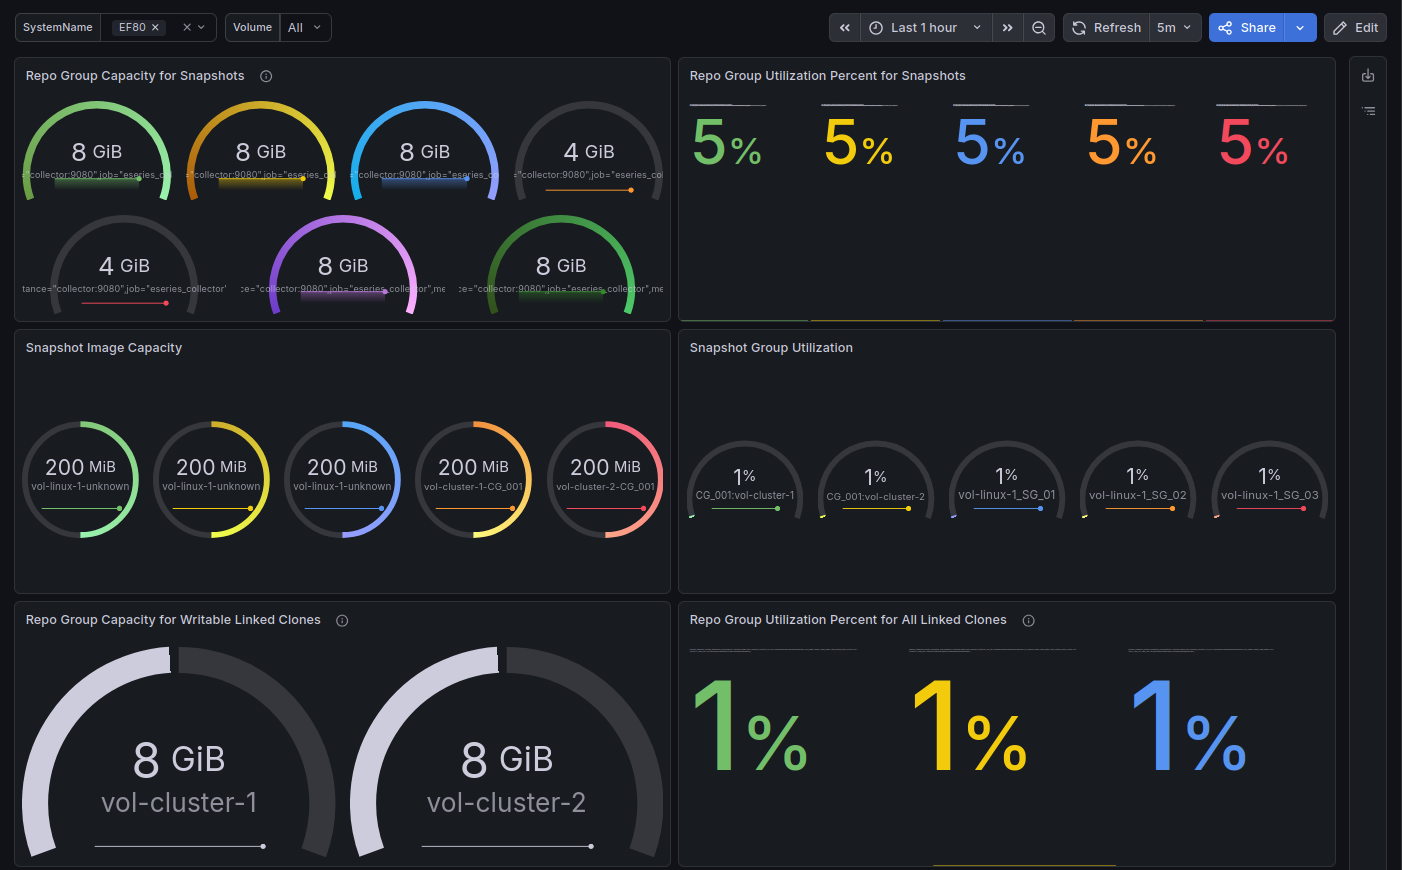
We can see reserved capacity allocated to both snapshots and Linked Clones. (Snapshot and clone counts and other details can also be visualized, but that is not shown in the dashboard.)
Aggregation in that Snapshots and Linked Clones dashboard could be done better (e.g. a CG snapshot results in multiple gauges), but that's a matter of preference and proportional to the effort/skill invested in creating Grafana panels.
EPA 3 didn't have a snapshot dashboard because it's performance-focused and only the recent release added limited repo groups capacity and snapshot total. ESC does collect more and these metrics are very useful, so full snapshot information is now going to be available in EPA 4.
I'm excited about snapshots and clones in EPA because among the many configuration details that ESC collected, those are the most valuable addition overall because they're more detailed than in ESC and because until now they were the hardest part of SANtricity to monitor (until the recent updates to SANtricity Client library and, soon, EPA 4, that is).
Although I see storage snapshots as losing importance, for the minority of users who do use them the lack of tooling and observability turns SANtricity snapshot into a freaking nightmare. I've created client-side tools that work well for my needs, accessibility (for Kubernetes users) is work-in-progress, so monitoring remains the last item that will be addressed in EPA 4.
Other details
I haven't shown a sample dashboard for SSD Flash Cache metrics, which was recently added to EPA 3 because I don't have a hybrid system to create a reference dashboard for it. It will remain available to users of hybrid SANtricity systems.
EPA Collector is finally getting "split" into multiple files, as it reached approximately 4,500 lines of code during recent development. Due to various improvements and project simplification, version 4 will be less than 4,000 lines and remain user-readable and user-editable.
A full EPA stack (with Grafana, etc.) will be provided but users are encouraged to use own, existing monitoring infrastructure rather than build storage-centered islands of monitoring.
At the top I mentioned EPA's "E-Series First" focus. I don't know what others will or won't do, but this is what you can expect from EPA 4:
- Kubernetes deployment manifests will be maintained and improved
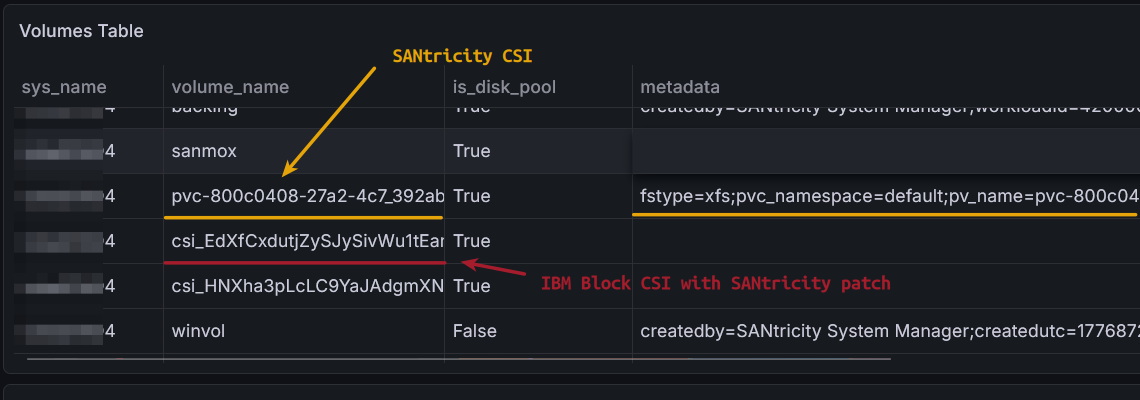
- EPA 4 will collect SANtricity CSI metadata for Kubernetes users
- I've been exploring Velero integration from both data and observability sides. I don't plan to Velero metrics in EPA 4, but E-Series metrics from SANtricity CSI can be created in a way that makes them accessible to Prometheus clients that have access to both Velero and EPA metrics
- Additional integrations will be explored immediately after EPA 4.0 release. Like in the Velero approach, they will be centered around E-Series solutions and recipes for 3rd party applications or virtualization/containerization stacks
SANtricity CSI volume metadata captured by EPA 4:
Conclusion
The new EPA 4.0.0 beta 1 version has been posted to Github.
It simplifies and improves on the EPA 3 features, adopts successful ideas from ESC 4 and allows me to integrate EPA with E-Series solutions in ways others won't or can't.
EPA 3 users who "do nothing" will receive updates and fixes for reported bugs for a while. EPA 3 is very simple, so the only thing that needs to be updated from time to time is 3rd party Python module dependencies. I don't remember that I've ever encountered a situation in which a Python module update broke EPA Collector. For all practical purposes, anyone can maintain EPA by themselves. SANtricity 12 so far seems to be compatible with version 11.9, so EPA 3 won't need major changes for a while. If you do spot any issues related to SANtricity 12, just report them in coming weeks or months, and they'll be fixed.
EPA 3 users who do move to version 4 shouldn't expect major loss of functionality. MEL is being removed, but "active failures" and existing Prometheus alerts already fill that gap.
Performance metrics are becoming live, snapshots and linked clones very observable, and integrations with E-Series solutions - official and others - will receive a boost.