Evaluating ONTAP S3 performance with s3tester
ONTAP has had S3 service for a while now. While ONTAP S3 isn't meant to take over large and complex S3 workloads in which NetApp StorageGRID excels, it is more than capable of servicing many S3 requirements.
People use ONTAP S3 for various purposes, from container registry (Red Hat Quay) to generic small to medium S3 workloads.
Requirements
Recently I got a question about the viability of ONTAP S3 for the hosting of JavaScript libraries and similar static files for internal Web applications.
This customer has a few thousand users and one of existing all-flash ONTAP appliances would be used to provide S3 service.
This sounded like a relatively simple question. I figured we'd need about few hundred requests per second and probably even less if a caching layer is in place. Should be easy!
Tests
Despite these guesstimates, I wanted to run some tests to see if those assumptions sounded about right.
I used s3tester to evaluate GET (which I figure could be 90% of the workload) and HEAD performance on ONTAP 9.10.1.
I ran the usual test (PUT, GET, HEAD, DELETE) to evaluate requests per second, focusing on GET.
I was relying on ONTAP System Manager performance charts here, and quickly concluded that with 50 concurrent requests (see the second run in green rectangle) I could get IOPS similar to what I get with 100 concurrent requests (the first two Latency bumps in green rectangle), but with a much better latency.
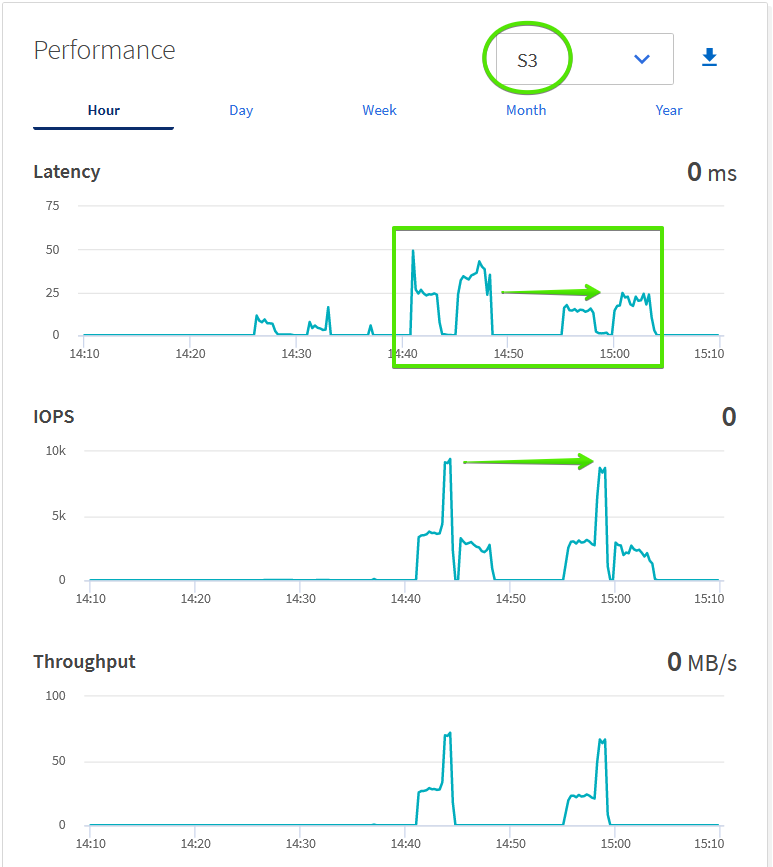
Why there are two latency bumps in each run?
- PUT - 100% writes, latency goes up
- GET - 100% read, latency drops to almost zero, but IOPS go to maximum
- HEAD - 100% small read, latency very low, very little network traffic
- DELETE - 100% delete, latency goes up again, very little network traffic
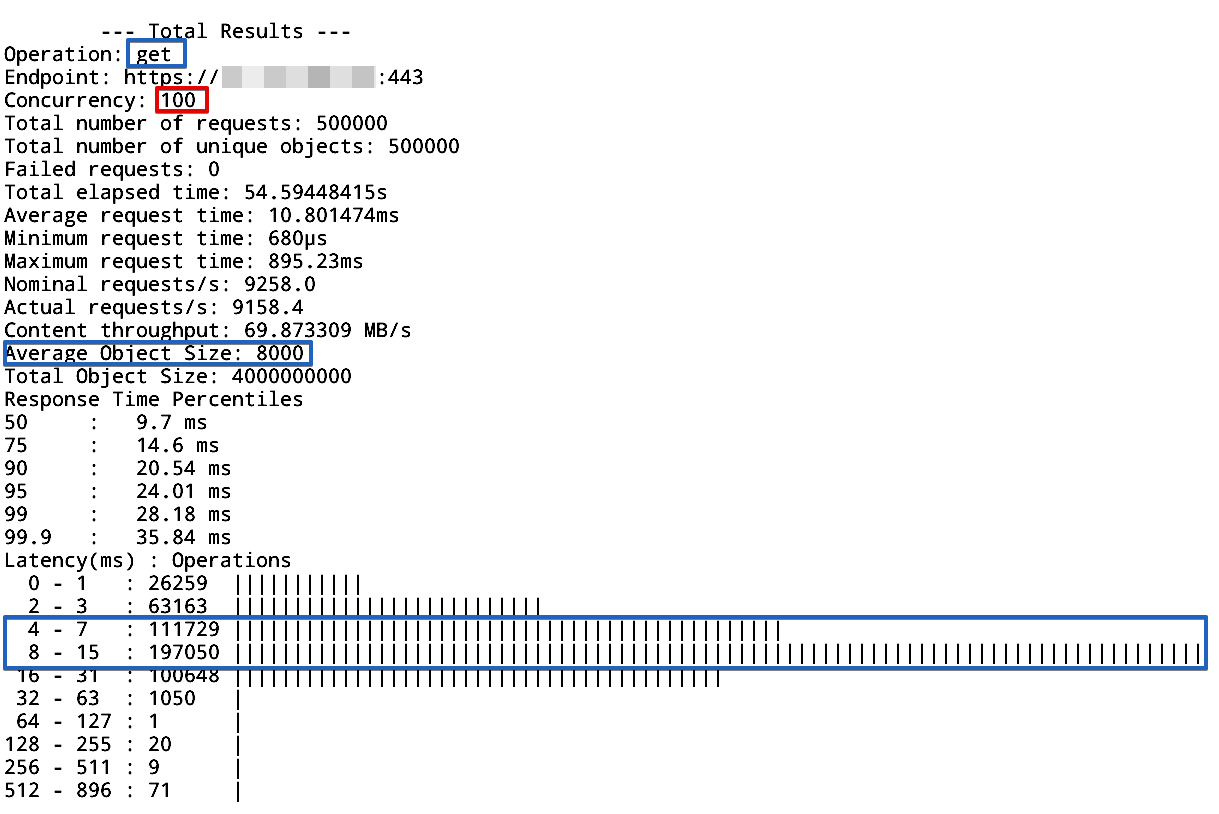
s3tester spits out a result for each test and GET got me around 9,000 requests per second with 10ms latency. I used a consistent 8KB object size in all tests.
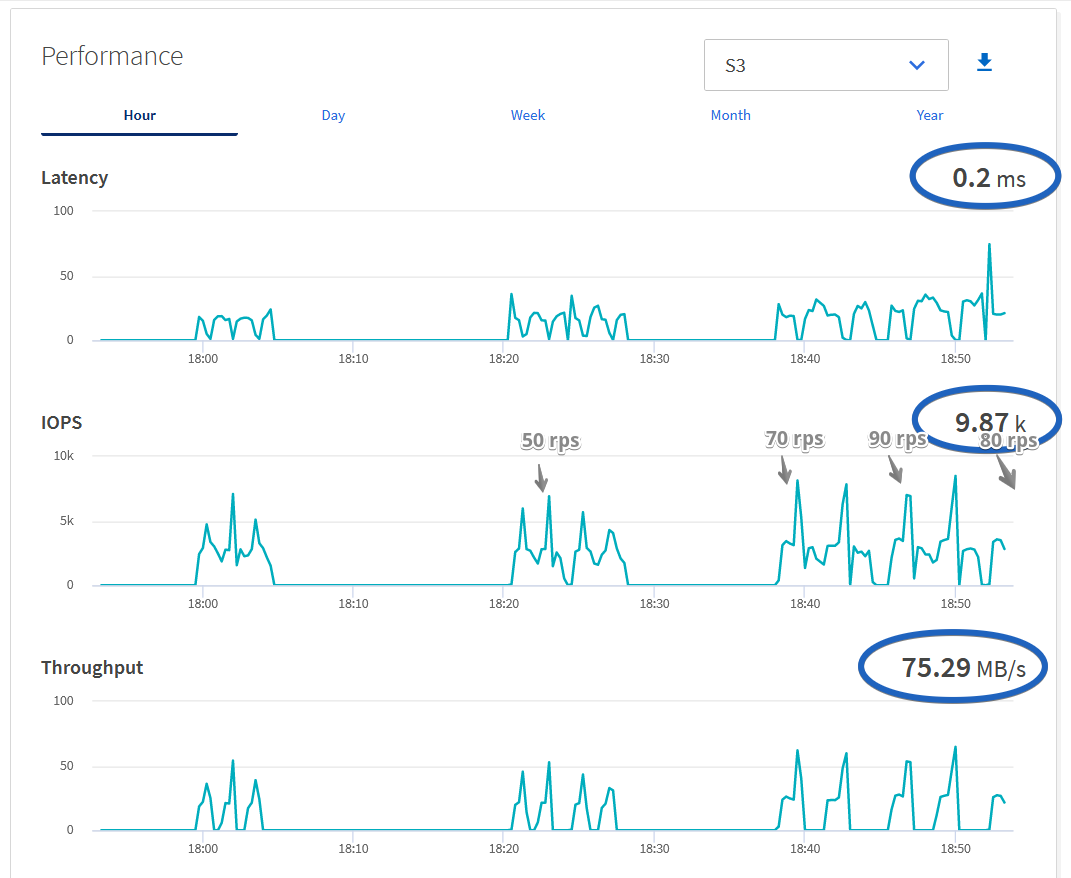
Later on I tried few more variants, and concurrency level (not "rps") 80 worked best in this environment. Although the chart lines hadn't been drawn yet, we can see the IOPS number shows 9.87k (GET) IOPS per second.
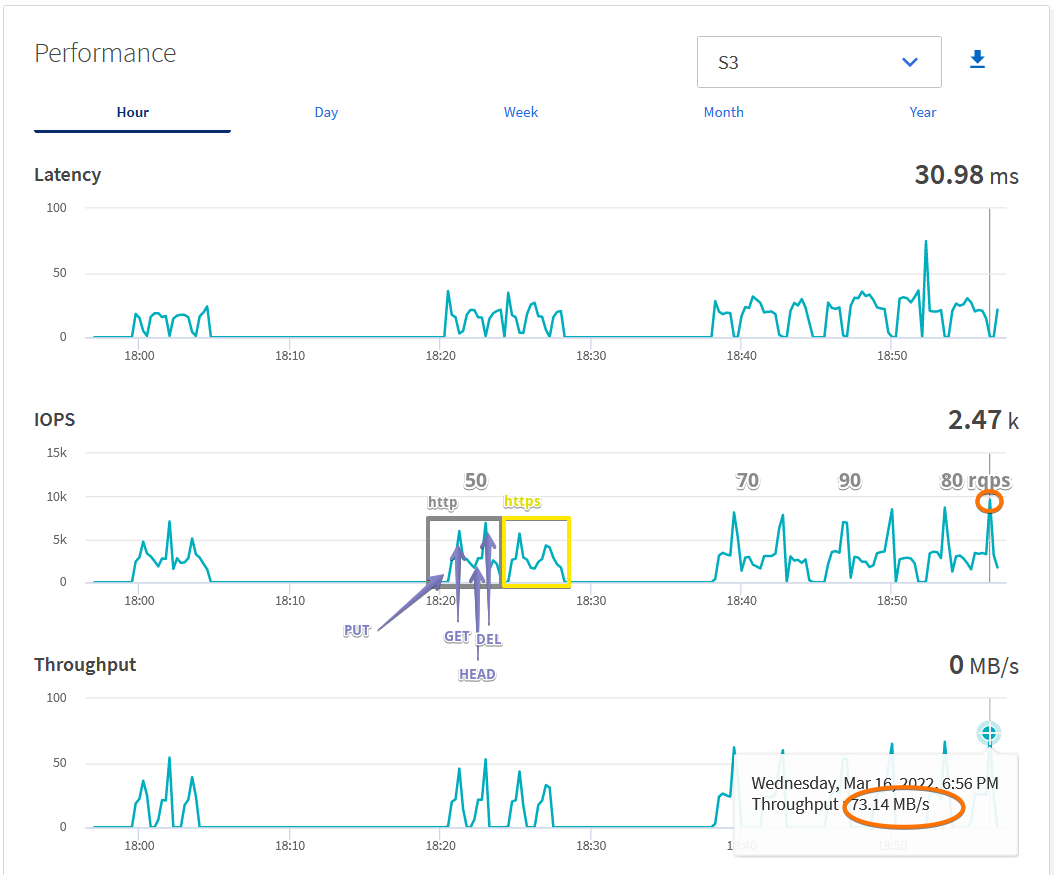
I took a screenshot of the same period again to show that point drawn on the chart (orange circle). You can also see my annotations for stages of each run at the center.
I forgot to save the result with concurrency 80, but here's the GET result with concurrency 70:
        --- Total Results ---
Operation: get
Endpoint: https://s3.com.org:443
Concurrency: 70
Total number of requests: 199990
Total number of unique objects: 199990
Failed requests: 0
Total elapsed time: 22.024509172s
Average request time: 7.592932ms
Minimum request time: 670µs
Maximum request time: 457.99ms
Nominal requests/s: 9219.1
Actual requests/s: 9080.3
Content throughput: 69.277485 MB/s
Average Object Size: 8000
Total Object Size: 1599920000
Response Time Percentiles
50     :   6.67 ms
75     :   10.24 ms
90     :   14.25 ms
95     :   16.52 ms
99     :   20.2 ms
99.9   :   26.56 ms
Latency(ms) : Operations
  0 - 1   : 18156 ||||||||||||||||||||||
  2 - 3   : 35321 ||||||||||||||||||||||||||||||||||||||||||
  4 - 7   : 67644 |||||||||||||||||||||||||||||||||||||||||||||||||||||||||||||||||||||||||||||||||
  8 - 15  : 66855 ||||||||||||||||||||||||||||||||||||||||||||||||||||||||||||||||||||||||||||||||
 16 - 31  : 11897 |||||||||||||||
 32 - 63  : 47    |
 64 - 127 : 2     |
128 - 255 : 27    |
256 - 458 : 41    |
Compared to results with 90 concurrent requests this result has a lower latency. In the both cases we had no failed GET requests.
I think less than 1,000 GET requests per second should enough for this customer, especially if a reverse proxy were to be added in front of ONTAP S3. But clearly ONTAP S3 is capable of much more.
This isn't to say it can handle anything. I did manage to hit some timeouts (not on GETs, though).
2022/03/16 18:48:37 Failed delete on object bucket 'bucket/test-146604': ServiceUnavailable: Reduce your request rate.
        status code: 503, request id: , host id:
Is this concerning? And shouldn't latency on flash be lower? No and no.
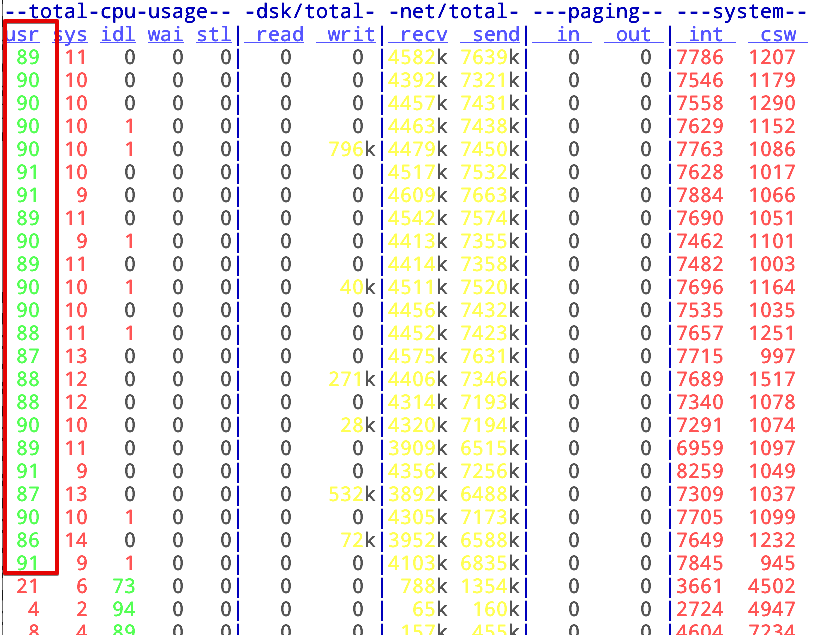
First, I ran s3tester from a single VM which was a bottleneck itself.
Second, ONTAP S3 itself was just a VM. (VM label is misleading as VM was upgraded to 9.10.1 since it was deployed.)
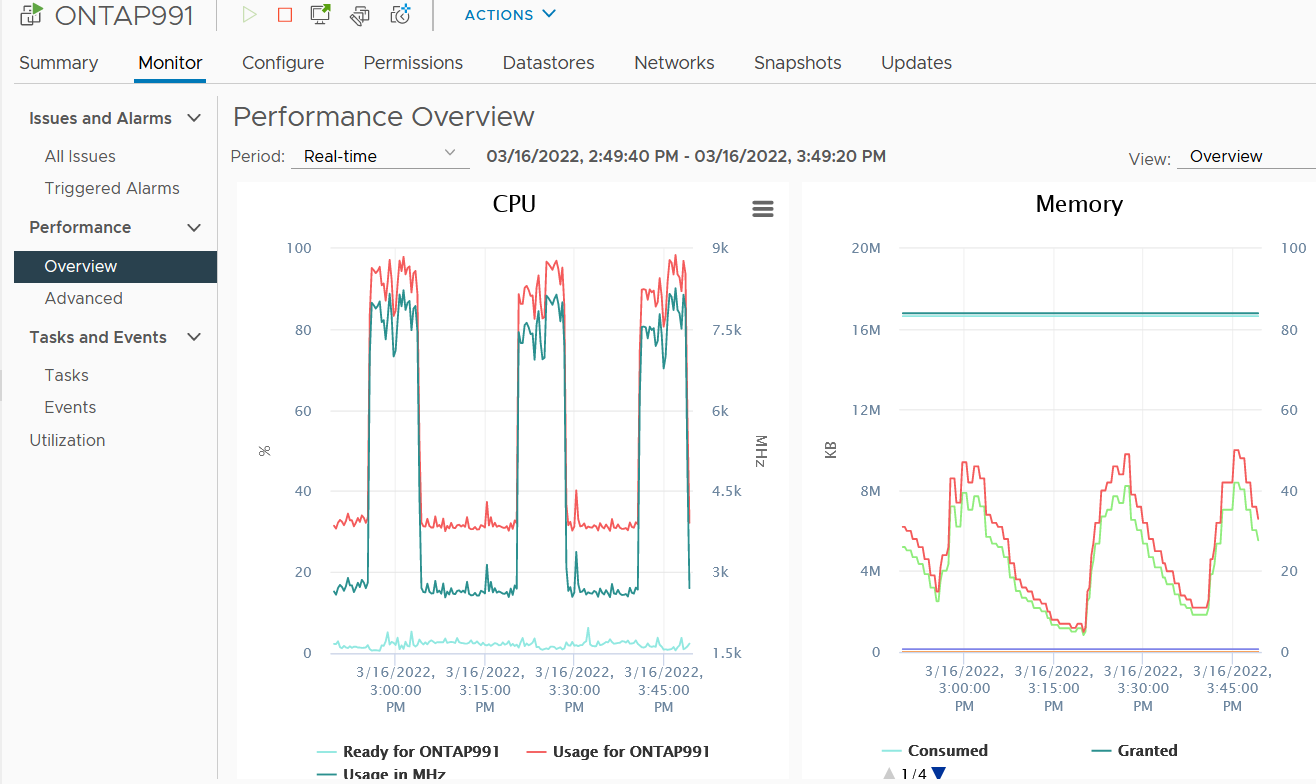
And that was a small VM (4 vCPU, ESXi 7, Xeon Silver from 2018) with external storage on a single NetApp HCI (SolidFire iSCSI) volume, so one thing that we can safely conclude here is that s3tester and ONTAP Select managed to max out the modest VM resources allocated to S3 client and ONTAP Select S3 server. We could have increased these resources, but we were interested in meeting a specific requirement rather than achieving the maximum S3 server performance.
Take aways
In conclusion, even this ONTAP Select can more than satisfy customer's requirements.
Any all-flash ONTAP appliance should be able to deliver S3 performance that's multiple times higher than what we observed in these s3tester runs.
Reverse proxies could be added to further improve GET and HEAD performance.