Glances plugin for SANtricity in DAS environments
Glances plugins
Glances is a host-, not cluster- or fleet-focused monitoring system, but many E-Series users may have just a host or two (including in Active-Passive HA clusters, so it's really like one) configured anyway.
So I figured it wouldn't be out of place to add a simple SANtricity plugin monitor to it. Sometimes I just need to see what the array (in addition to system and network) is up to and don't want to run a monitoring stack 24x7.
Glances plugin for SANtricity
The way it looks is like this (open in a new tab if needed):
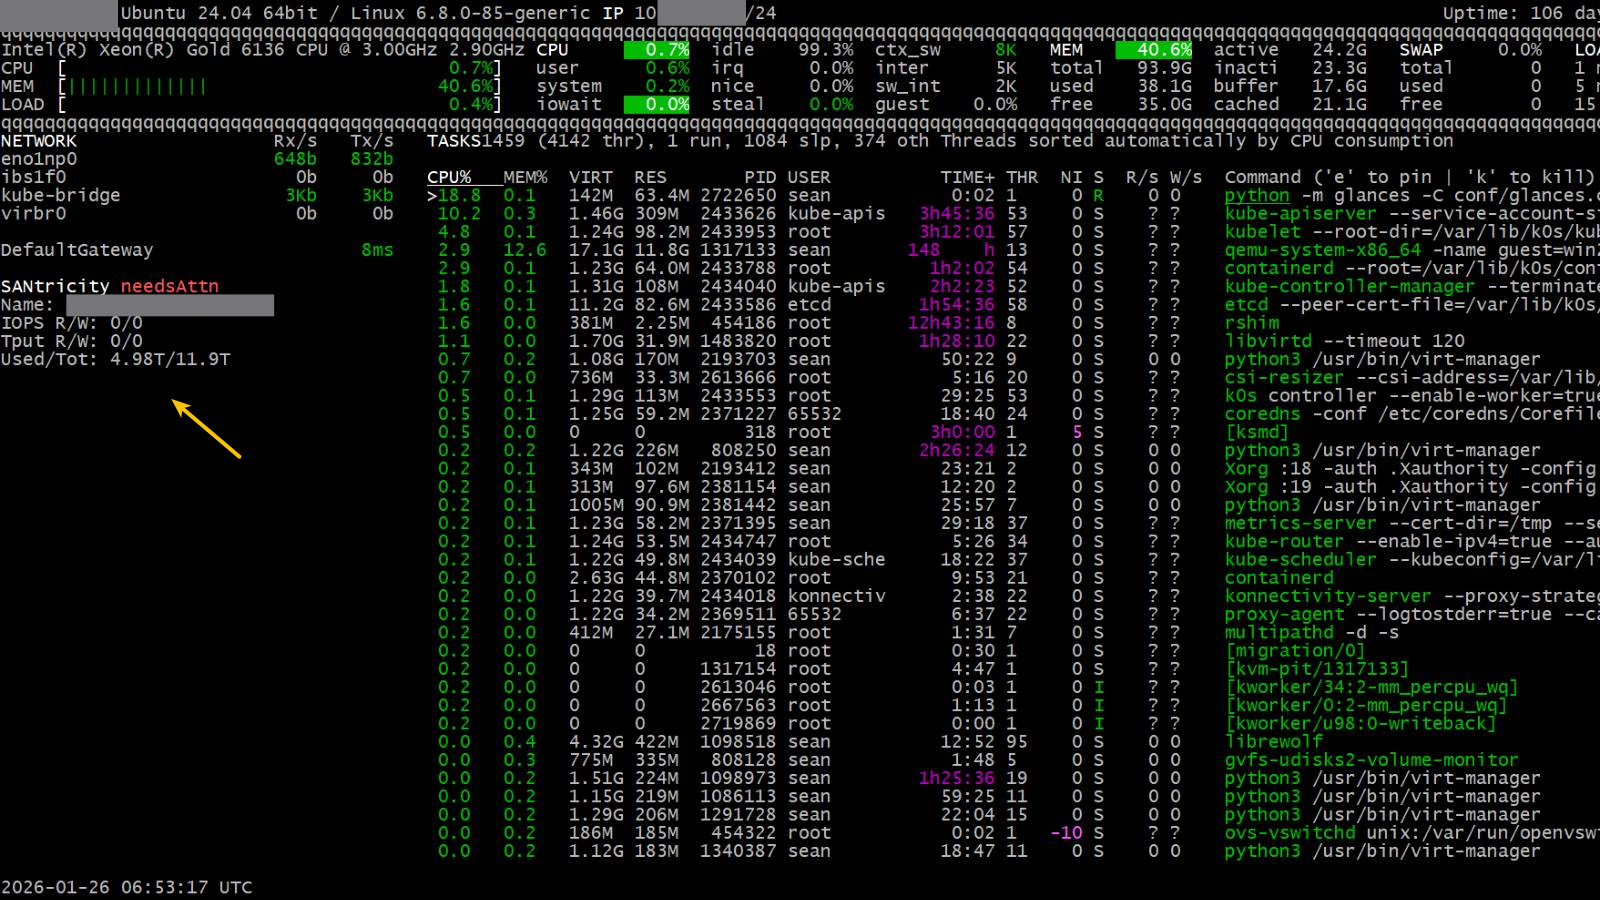
- Status (optimal or not)
- IOps and Throughput
- Capacity (Used and Total, in TiB)
The first comes from GET /storage-systems (status), the second from GET analysed-system-statistics (averaged, updated once every 5-minutes - it's "low energy", but I think that's good enough), and the third is also from GET /storage-systems (the capacity).
It's easy to add more stuff or get "point-in-time" performance stats, of course, but that's not what this plugin is for. It's for casual glancing (pun intended).
And there isn't enough space to show more stuff without customization. Those familar with Glances already know that and have noticed that Disk IO and Sensors are missing, which is something I had to do in order to not have SANtricity pushed off the screen in the left side panel.
Glances also has a Web UI, but I did not try to use it. There's a Vue component for SANtricity and the UI imports it. It either shows these details okay or can do it with a bit of extra tinkering. We know the plugin works, it's just a matter of making sure it's loaded and displayed (both of which are in place). A Web UI is something one usually runs 24x7, so I assume E-Series users don't do that a lot with Glances.
Where is it and how to try?
It's at https://github.com/scaleoutsean/glances. I don't know if I should submit to upstream because I'm not sure many users would need it and I'm lazy to check if the Web UI works. For now, you can get it as per this link.
E-Series users who just want to check how SANtricity storage system is doing can use this plugin without setting anything up.
git clone https://github.com/scaleoutsean/glances
cd glances
# Install venv and activate it
# The most basic way to run is without setting things up.
pip install psutil jinja2 requests
# Edit configuration file
# - in the [santricity] section, remove # from the hosts line to make the plugin know where to fetch data
# - in line 31, add santricity (https://github.com/scaleoutsean/glances/blob/afc6faa172d1d53337923c238d5c90826a0c5b76/conf/glances.conf#L31)
vim conf/glances.conf
# conf/glances.conf has left_panel setting where santricity is listed
#  - diskio and sensors hog out the rest, need to be removed if you have many of them (as one does enterprise servers)
#  - santricity can be added here
# List modules - see if "santricity" shows
# python -m glances -C conf/glances.conf --modules-list
python -m glances -C conf/glances.conf --disable-plugin diskio --disable-plugin sensors --enable-plugin santricity
# Get log location of your log
# python -m glances -C conf/glances.conf -V
# Tail if you have issues
# tail -f /home/sean/.local/share/glances/glances.log
I expect the audience for this would be E-Series users with directly attached storage (both single host and HA pairs), but maybe someone will find it useful in other environments as well.